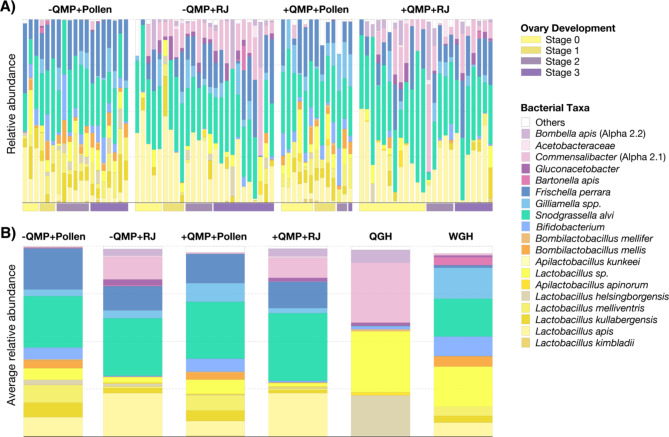
Fig. 4.
Taxonomic classification of bacteria present in honey bee guts. (A) Relative abundance of each bacterial taxon within individual worker bees from each of the four experimental groups (-QMP + Pollen, -QMP + RJ, +QMP + Pollen, +QMP + RJ). Vertical bars represent the relative abundance of the bacterial taxa and horizontal bars along the bottom of the graph indicate the ovary development stage (0–3) of the workers. (B) Average relative abundance of bacterial taxa in the workers from each experimental group compared to the queen (QGH) and worker (WGH) gut homogenates that were used to inoculate all experimental bees in our study. See Dataset S1 for raw relative abundance data

