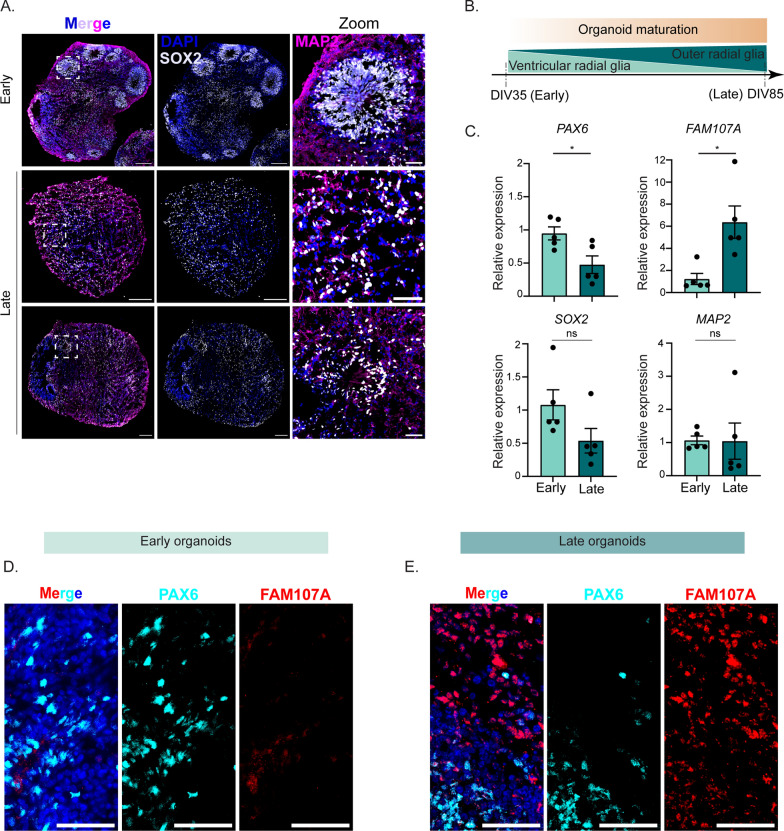
Fig. 4.
Early and late forebrain organoids display different morphology, protein expression, and protein localization. A Representative immunofluorescence images of early and late forebrain organoids. DAPI (blue) stains nuclei, MAP2 (magenta) stains maturing neurons, and SOX2 (grey) indicates neural stem cells. Scale bar of the whole organoid—200 µm and scale bar of zoom—50 µm B Schematic of cell type expression as organoids mature from DIV35 to DIV85 (C). RT-qPCR analysis of RNA harvested from uninfected forebrain organoids at DIV35 (early) and DIV85 (late). The data are normalized to the early samples and are presented as relative expression of the respective genes to GAPDH. Data are presented as means ± SEM (n = five biological replicates). Statistical analysis was performed with unpaired student’s t-test. D, E Representative immunofluorescence images of early (D) and late (E) uninfected forebrain organoids. DAPI (blue) stains nuclei, PAX6 (cyan) marks ventricular radia glia cells, and FAM107A (red) indicates outer radial glia cells. Scale bar—50 µm

