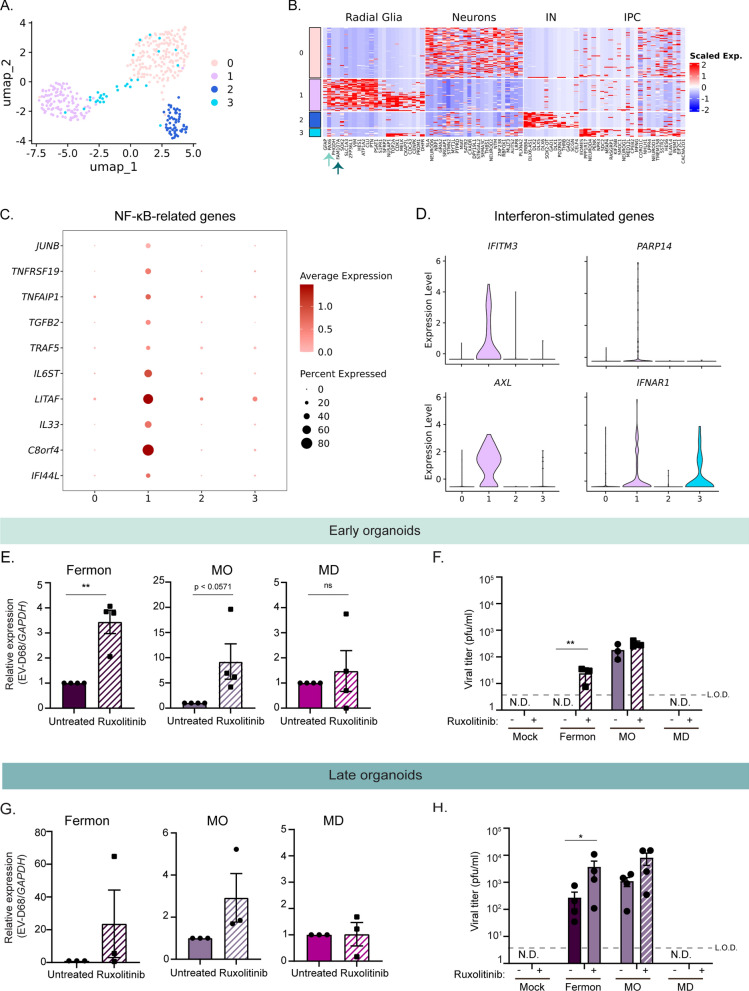
Fig. 5.
Distinct antiviral signaling pathways are basally expressed in early forebrain organoids. A Uniform manifold approximation and projection (UMAP) of previously published single cell transcriptomics data representative of 393 cells from ventricular and sub-ventricular zone human fetal brain samples [25]. B Heatmap displaying distinct neural cell populations. Arrows highlight radial glia specific genes. C, D Dot plot displaying NF-kB genes (C) and violin plots displaying interferon stimulated genes (ISGs) (D) identified using differential gene expression analysis of cluster 1 (radial glia) compared to other clusters (cutoff = log2 fold-change = 1.9) (E). RT-qPCR analysis of lysates harvested at 7 dpi from DIV35 forebrain organoids untreated or treated with Ruxolitinib and simultaneously infected with Fermon, MO, or MD viruses. The data are normalized to untreated organoids and are presented as relative expression of EV-D68 to GAPDH with untreated set to 1. Data are presented as means ± SEM (n = four biological replicates). Statistical analysis performed with unpaired student’s t-test. F Plaque-forming assay of supernatants harvested at 7 dpi from forebrain organoids mock-infected or infected with either Fermon, MO, or MD at DIV35. Data are presented as means ± SEM (n = three biological replicates). Statistics performed with two-way ANOVA. N.D. = not detected (G). RT-qPCR analysis of lysates harvested at 7 dpi from DIV85 forebrain organoids untreated or treated with Ruxolitinib and simultaneously infected with Fermon, MO, or MD viruses. The data are normalized to untreated organoids and are presented as relative expression of EV-D68 to GAPDH with untreated set to 1. Data are presented as means ± SEM (n = three biological replicates). Statistical analysis performed with unpaired student’s t-test. (H). Plaque-forming assay of supernatants harvested at 7 dpi from forebrain organoids mock-infected or infected with either Fermon, MO, or MD at DIV85. Data are presented as means ± SEM (n = four biological replicates). Statistical analysis performed with two-way ANOVA. N.D. = not detected

