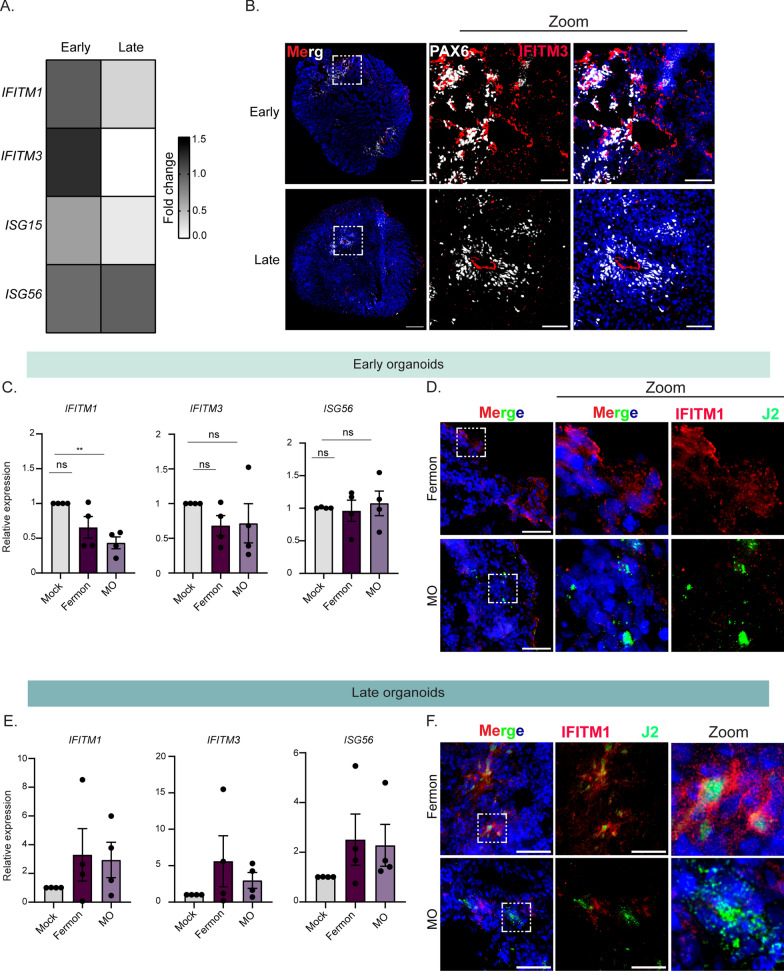
Fig. 6.
Differential interferon-stimulated gene expression during Enterovirus-D68 infection of early and late forebrain organoids. A Heat map of fold change values from RT-qPCR of lysates from early and late forebrain organoids for several interferon-stimulated genes. B Representative immunofluorescence micrographs of early and late forebrain organoids. Organoids were stained for DAPI (nuclei, blue), PAX6 (grey, ventricular radial glia cells), and IFITM3 (red). Dashed boxes indicate the location of the zoom images. Scale bar (tiled image)—200 µm; Scale bar (zoom image)—25 µm. C RT-qPCR analysis of lysates harvested at 7 dpi from DIV35 forebrain organoids mock-infected or infected with Fermon, MO, or MD viruses. The data are normalized to mock-infected organoids and are presented as relative expression of the respective interferon-stimulated gene to GAPDH with mock-infected set to 1. Data are presented as means ± SEM (n = four biological replicates). D Representative immunofluorescence images of early organoids infected with Fermon or MO viruses at 7 dpi. Organoids were stained for DAPI (blue, nuclei), J2 (green, virus), and IFITM1 (red). Scale bar—50 µm. E RT-qPCR analysis of lysates harvested at 7 dpi from DIV85 forebrain organoids mock-infected or infected with Fermon, MO, or MD viruses. Data are normalized to mock-infected organoids and are presented as relative expression of the respective interferon-stimulated gene to GAPDH with mock-infected set to 1. Data are presented as means ± SEM (n = three biological replicates). F Representative immunofluorescence images of late organoids infected with Fermon or MO viruses at 7 dpi. Organoids were stained for DAPI (blue, nuclei), J2 (green, virus), and IFITM1 (red). Scale bar—50 µm

