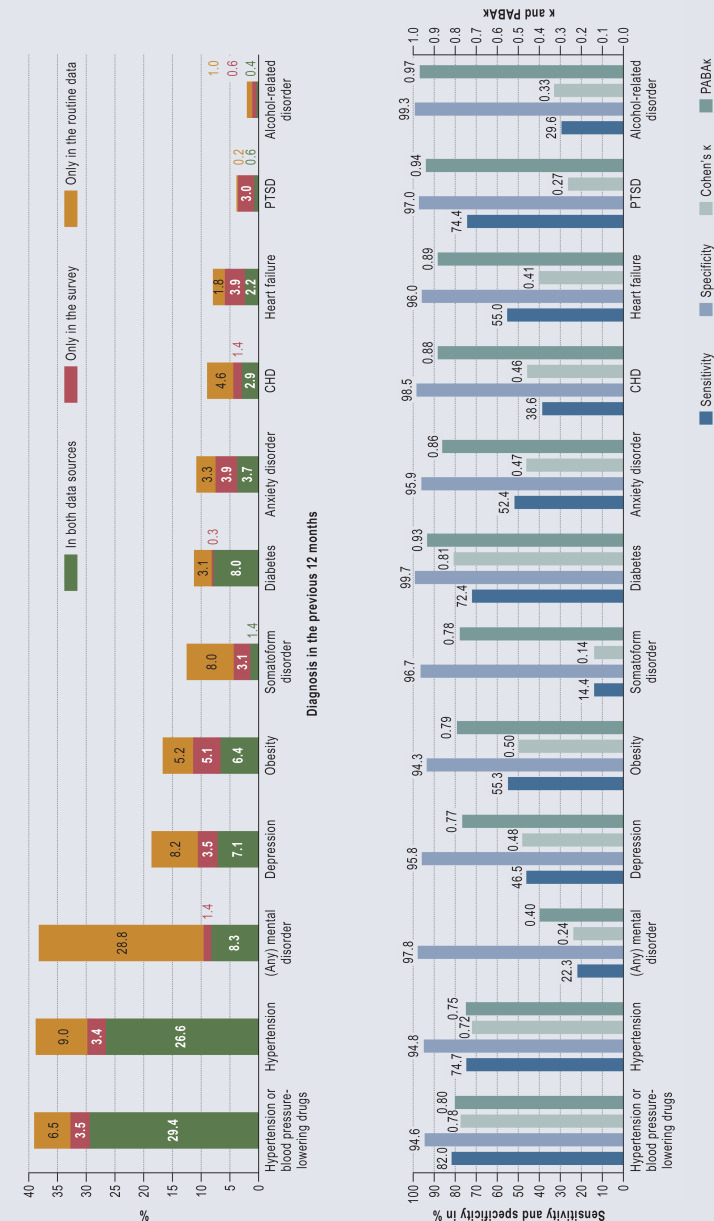
Figure.
Proportion of medical diagnoses as stated by patients in the survey and/or contained in routine data as well as the agreement in diagnoses between the two data sources using Cohen’s κ, PABAκ, sensitivity, and specificity.
The data relate to the 12 months preceding the time of the survey or to the 4th quarter of 2020–3rd quarter of 2021 (see data table in eTable 1 for illustration)
The proportion of individuals identified in at least one of the two data sources is calculated as the sum of the three proportions listed. Sensitivity corresponds to the percentage of people with a documented diagnosis in the routine data who also state the respective diagnosis in the survey, in relation to all people who have the diagnosis documented in the routine data. Specificity is the percentage of people without a documented diagnosis in the routine data who also do not state a respective diagnosis in the survey, in relation to all people who do not have a corresponding diagnosis documented in the routine data. κ, Cohen’s kappa measure of agreement; PABAκ, prevalence- and and bias-adjusted kappa; PTSD, post-traumatic stress disorder

