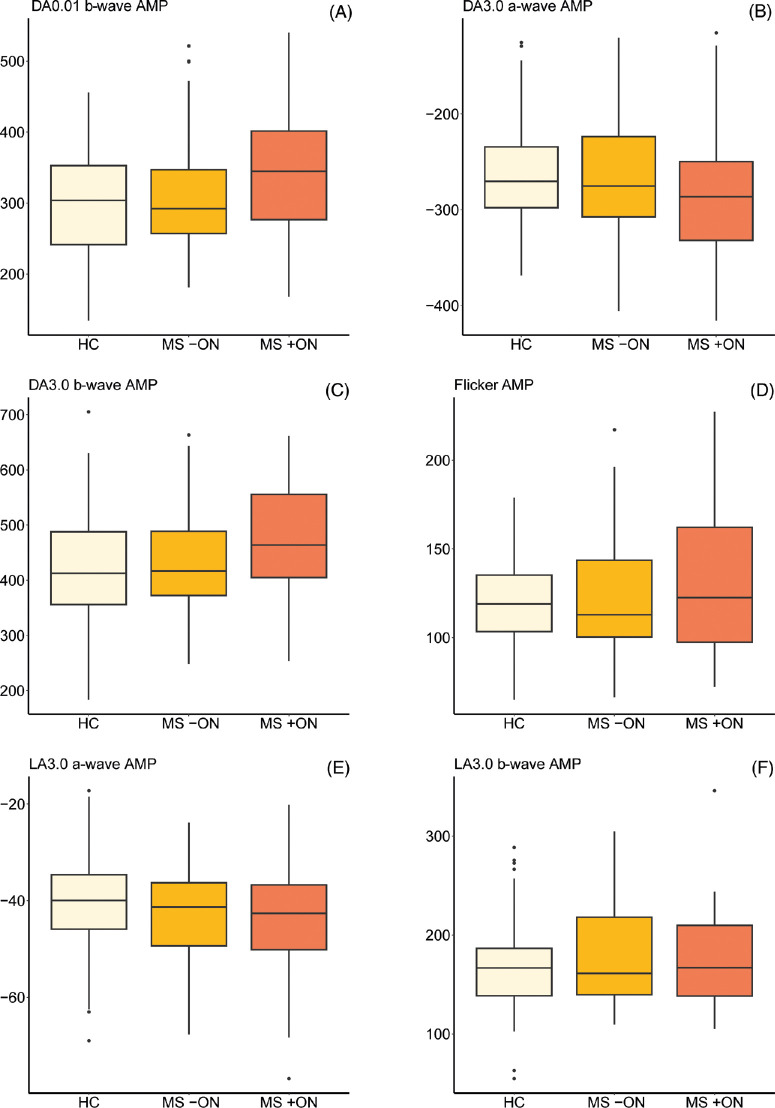
Figure 1.
(A–F) Boxplots showing ERG response amplitudes in eyes of people with multiple sclerosis both with (MS +ON) and without (MS −ON) previous ON with those of HC participants. Units on all y axes are microvolts. Median values and IQRs are indicated by horizontal lines and boxes, respectively; whiskers show the lowest and highest data points still within 1.5 IQR of the lower and upper quartiles. Individual outlying data points are represented by black dots. AMP, response amplitude; DA, dark adapted; LA, light adapted.

