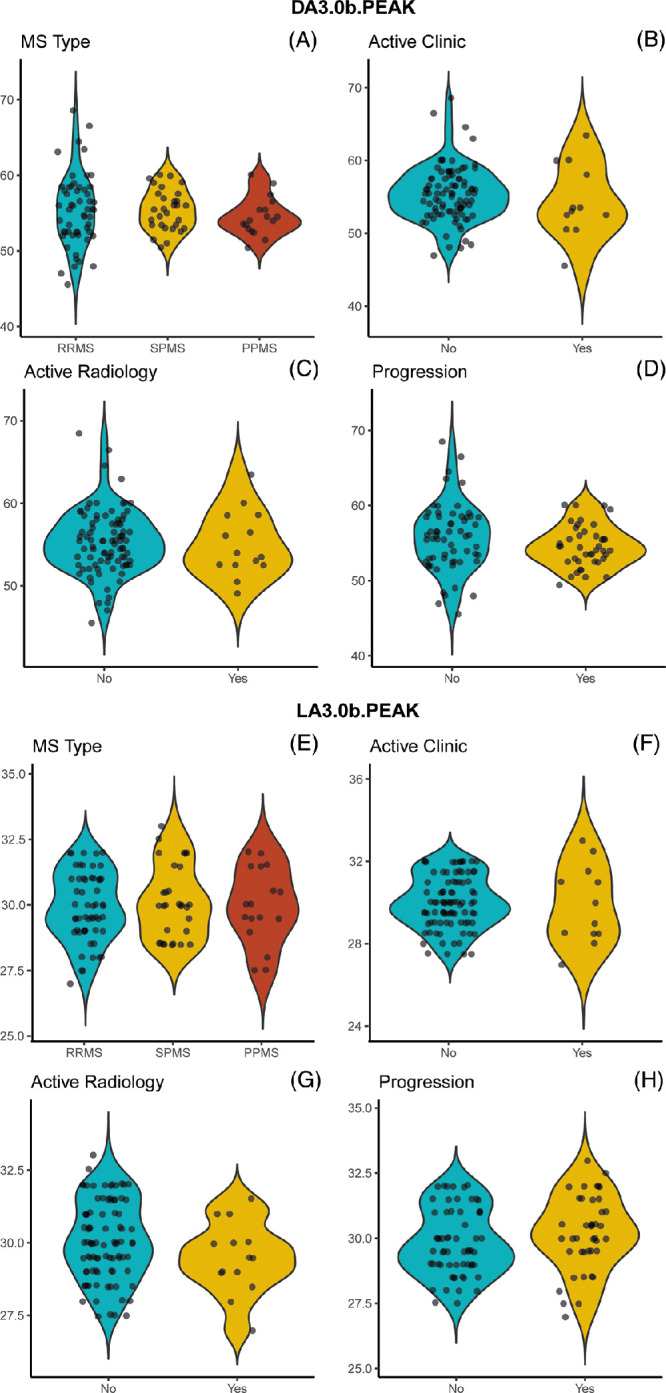
Figure 4.

(A–H) ERG peak times plotted against multiple sclerosis subtype (A, e) And Disease activity (clinically active, radiologically active, with evidence of progression, B–D and F–H, respectively). Peak times selected for display and analysis were the dark (A–D) and light adapted (E–H) 3.0 single flash responses, as discussed in the Statistical Analysis subsection. Data points are horizontally jittered for clarity. DA, dark adapted; LA, light adapted.
