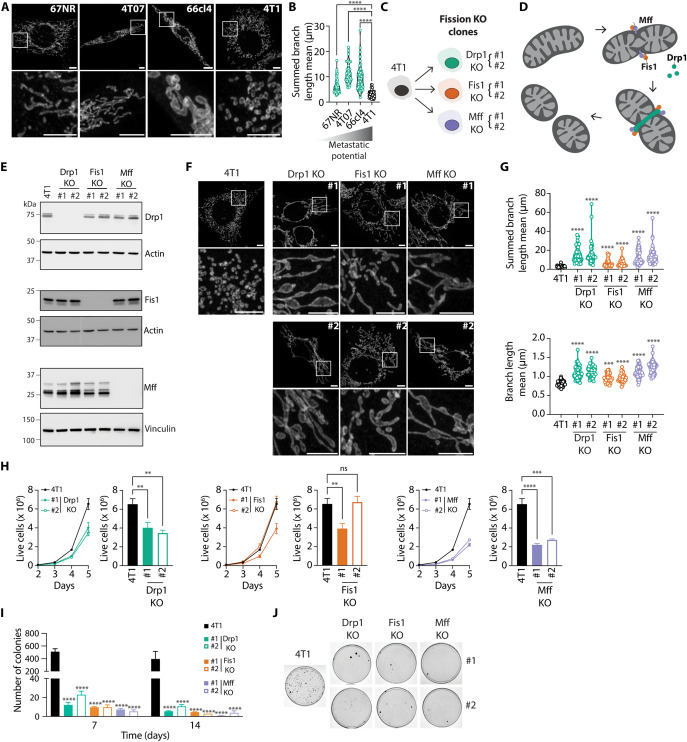
Fig. 1. Increased mitochondrial length is associated with low metastatic potential in breast cancer cells.
(A and B) Representative images (A, scale bars, 5 μm) and quantification of mitochondrial length (B) in Tom 20–stained 67NR, 4T07, 66cl4, and 4T1 breast cancer cells. In (B), each data point represents an individual cell (n = 34 to 81 per group). ****P < 0.0001 by Welch’s analysis of variance (ANOVA) and Dunnett’s T3 post-hoc test. (C) Schematic representation of the 4T1 KO cell lines generated for this study. Two independent clones (#1 and #2) were derived from each individual KO cell population (Drp1, Fis1, and Mff). (D) Schematic representation of mitochondrial fission highlighting the mitochondrial fission proteins Drp1, Fis1, and Mff. (E) Validation of KO cell lines by immunoblot. Representative images of three independent experiments. Actin or Vinculin served as loading controls. (F and G) Representative images (F, scale bars, 5 μm) and quantification of mitochondrial length (G) in Tom 20–stained parental, Drp1 KO, Fis1 KO, and Mff KO 4T1 breast cancer cells. In (G), each data point represents an individual cell (n = 33 to 42 per group). ****P < 0.0001 by Welch’s ANOVA and Dunnett’s T3 post-hoc test. (H) Live cell counts of parental versus Drp1 KO, Fis1 KO, and Mff KO 4T1 breast cancer cells over the course of 5 days. Bar graphs depict live cell counts on day 5. Results represented as mean ± SEM of three independent experiments. ****P < 0.0001, ***P < 0.001, **P < 0.01 by one-way ANOVA and Dunnett’s post-hoc test. (I and J) Number of colonies (I) and representative images of colonies (J) observed in 4T1 parental versus Drp1 KO, Fis1 KO, and Mff KO clones after culture in ultralow attachment plates for 7 (I) and 14 (I and J) days. In (I), results are represented as mean ± SEM of five (7 days) or three (14 days) independent experiments. ****P < 0.0001 by two-way ANOVA and Dunnett’s post-hoc test. ns, nonsignificant.

