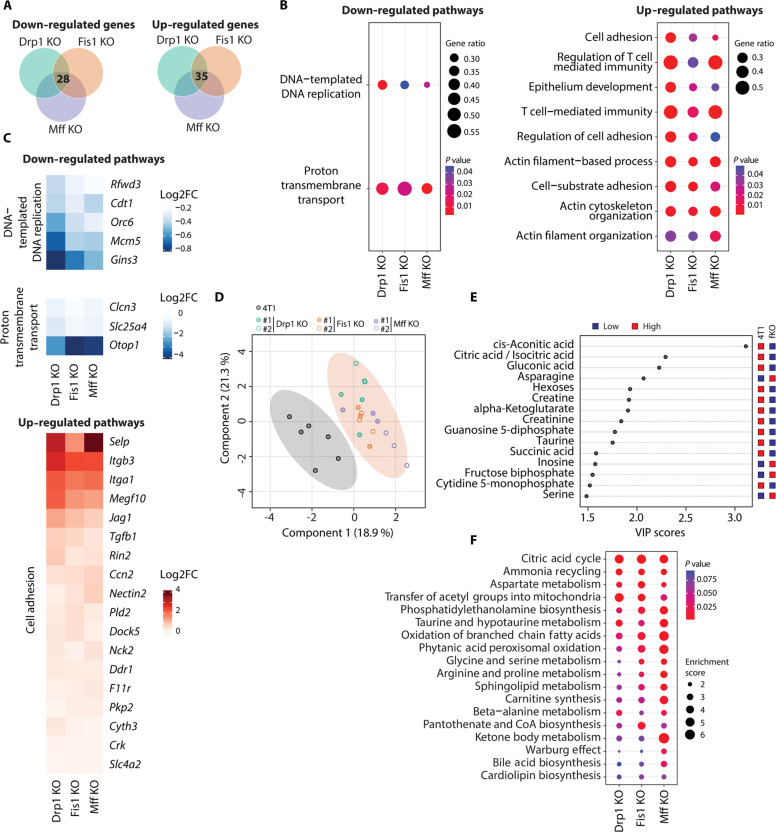
Fig. 2. Transcriptomic and metabolomic signatures of mitochondrial elongation in breast cancer cells.
(A) Venn diagrams depicting common down-regulated and up-regulated transcripts in all KO cell lines versus parental 4T1 breast cancer cells that were identified by DESeq analysis of RNA-seq data (n = 3), |FC| > 1.5 and P adjusted value <0.05. (B) Dot plots of common down-regulated and up-regulated pathways in all KO cell lines versus parental 4T1 breast cancer cells, according to GSEA. GeneRatio is calculated as follows: count of core enrichment genes/count of genes present in the indicated pathway. (C) Heatmaps showing common affected genes in all KO cell lines versus parental 4T1 breast cancer cells from selected pathways in (B). (D) PLS-DA of metabolite profile data between parental and fission KO 4T1 cell lines. All KO cell lines were grouped into one category (fKO), contained in the light shaded orange circle. Each data point represents one sample (n = 6 for parental 4T1, n = 3 for each KO clone). (E) VIP scores of top 15 metabolites. All fission KO cell lines were grouped into one category (fKO) and compared to parental 4T1 breast cancer cells. (F) Dot plots of common altered metabolic pathways in all KO cell lines versus parental 4T1 breast cancer cells, according to MSEA.

