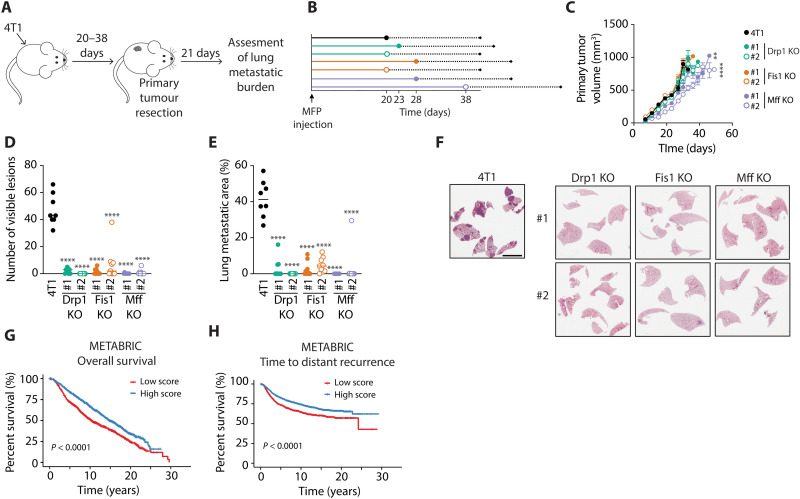
Fig. 4. Loss of mitochondrial fission mediators in triple-negative breast cancer cells limits lung metastasis in an immunocompetent mouse model.
(A) Schematic depicting the experimental design of the spontaneous metastasis assays conducted to assess metastatic potential of parental versus Drp1 KO, Fis1 KO, and Mff KO 4T1 breast cancer cells in vivo. Cells were injected into the mammary fat pads (MFPs) of mice and tumor growth was assessed for 20 to 38 days. Tumors were resected when they reached 500 mm3. Twenty-one days after resection, lung metastatic burden was evaluated. (B) Diagram showing the median time required for each cell line to reach resection size. (C) Primary tumor growth of parental versus Drp1 KO, Fis1 KO, and Mff KO 4T1 breast cancer cells. Graph shows mean tumor volume over time ± SEM (n = 9 per group). ****P < 0.0001, **P < 0.01 by mixed-effects model and Dunnett’s posttest. (D and E) Number of visible lesions (D) and total metastatic lesion area (E) quantified in the lungs of mice bearing parental versus Drp1 KO, Fis1 KO, and Mff KO 4T1 tumors. Results are shown as individual data points, where each data point represents an individual mouse, and mean is depicted as a line (n = 8 for parental 4T1, n = 9 for all KOs). ****P < 0.0001, by one-way ANOVA and Dunnett’s post-hoc test. (F) Representative images of H&E-stained lungs from mice injected with parental versus Drp1 KO, Fis1 KO, and Mff KO 4T1 breast cancer cells. Scale bar, 4 mm. (G and H) Kaplan-Meier overall survival (G) and time to distant recurrence (H) analysis of patients from the METABRIC study. A gene expression signature associated with impaired mitochondrial fission was constructed using the genes identified in Fig. 2A. Patients were divided in two groups according to their gene signature score.

