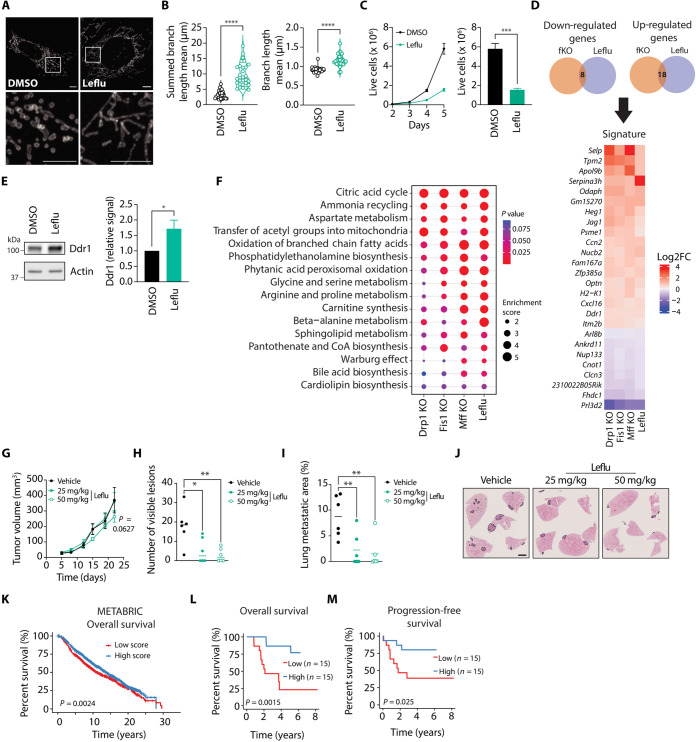
Fig. 6. Leflu treatment promotes mitochondrial elongation in breast cancer cells and hinders their metastatic capacity in vivo.
(A and B) Representative images (A, scale bars, 5 μm) and quantification of mitochondrial length (B) in Tom 20–stained 4T1 cells treated with Leflu or DMSO. In (B), each data point represents an individual cell (n = 29 per group). ****P < 0.0001 by Welch’s t test. (C) Left: Proliferation curve of Leflu- and DMSO-treated 4T1 cells. Right: Live cell counts on day 5 (N = 4). ***P < 0.001 by unpaired t test. (D) Venn diagrams (top) and heatmap (bottom) depicting common altered genes in fission KO (fKO) and Leflu-treated 4T1 cells. (E) Common altered metabolic pathways in Leflu-treated and fission KO 4T1 cells. (F) Representative immunoblot and densitometric analysis of Ddr1 signal relative to actin signal. *P < 0.05 by unpaired t test (N = 4). (G) Tumor growth curve of Leflu- versus DMSO-treated mice (n = 6 per group). P = 0.0627 by mixed-effects model and Dunnett’s post-hoc test. (H and I) Number of visible lesions (H) and total metastatic area (I) in lungs of Leflu- versus DMSO-treated mice. Each data point represents an individual mouse, and mean is depicted as a line (n = 6 per group). **P < 0.01, *P < 0.05, by one-way ANOVA and Dunnett’s post-hoc test. (J) Representative images of H&E-stained lungs from Leflu- versus DMSO-treated mice. Scale bar, 2 mm. (K) Kaplan-Meier overall survival analysis of patients from the METABRIC study. A gene expression signature associated with enhanced mitochondrial elongation was constructed using the genes identified in (D). Patients were divided into two groups according to their signature score. (L and M) Overall (L) and progression-free (M) survival of patients belonging to an aggressive breast cancer cohort. Patients were categorized according to their signature scores and separated by the median score into two groups (low and high) to conduct survival analyses. Unless indicated otherwise, all data are presented as mean ± SEM.

