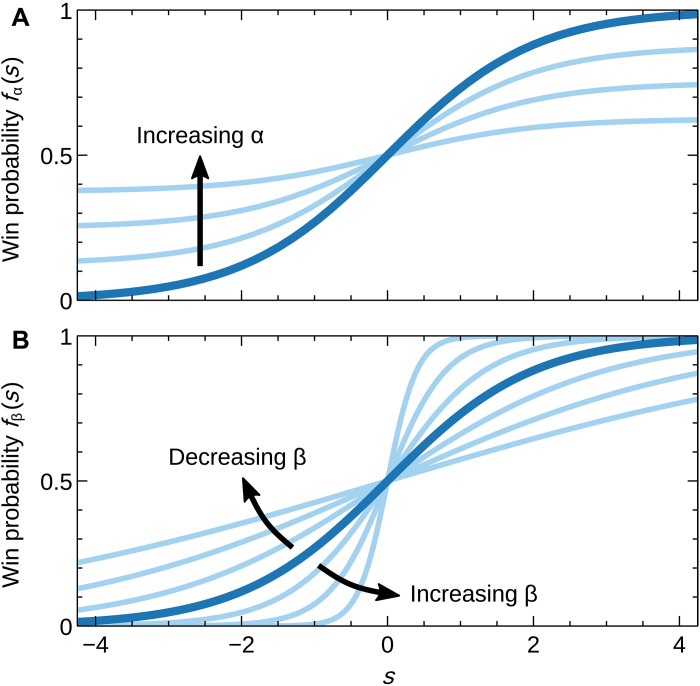
Fig. 1. Score functions.
(A) The bold curve represents the standard logistic function f(s) = 1/(1 + e−s) used in the Bradley-Terry model. The remaining curves show the function fα of Eq. 8 for increasing values of the luck parameter α. (B) The score function fβ of Eq. 9 for different values of the depth of competition β, both greater than 1 (steeper) and less than 1 (shallower).

