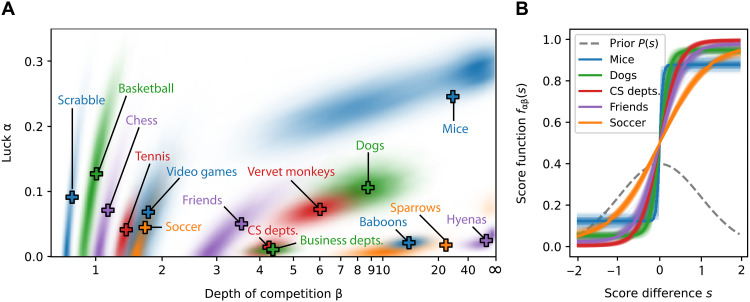
Fig. 2. Posterior distributions of luck and depth, and fitted score functions.
(A) Each cloud represents the posterior distribution P(α, β ∣ A) of the luck and depth parameters for a single dataset, calculated from the Monte Carlo sampled values of α and β using a Gaussian kernel density estimate. The + signs indicate the expected values of the parameters for each dataset. (B) The bold curve in each case corresponds to the expected values , while the other surrounding curves are for a selection of values sampled from the posterior distribution, to give an idea of the variation around the average.

