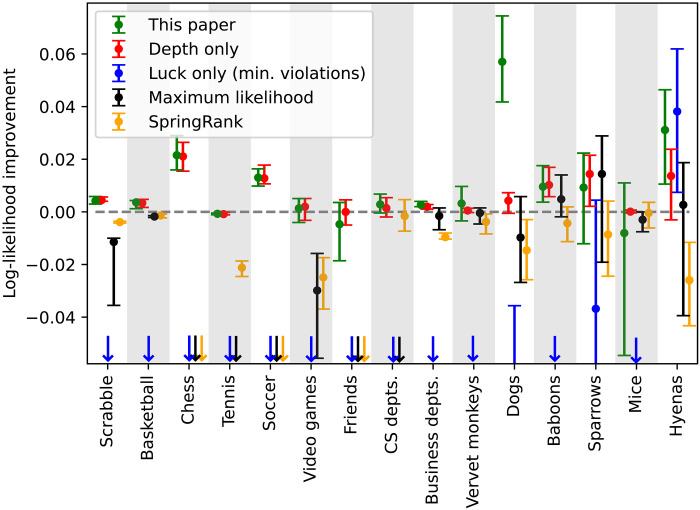
Fig. 3. Comparative performance of the method of this paper and a selection of competing methods.
Performance is measured in terms of the log-likelihood (base 2) of the actual outcomes of matches within the fitted model, which is also equal to minus the description length in bits required to transmit the win/loss data given the fitted model. Log-likelihoods are plotted relative to that of the standard Bradley-Terry model with a logistic prior (the horizontal dashed line). Error bars represent upper and lower quartiles over at least 50 random repetitions of the cross-validation procedure in each case. The arrows along the bottom of the plot indicate cases where the log-likelihood is outside the range of the plot.

