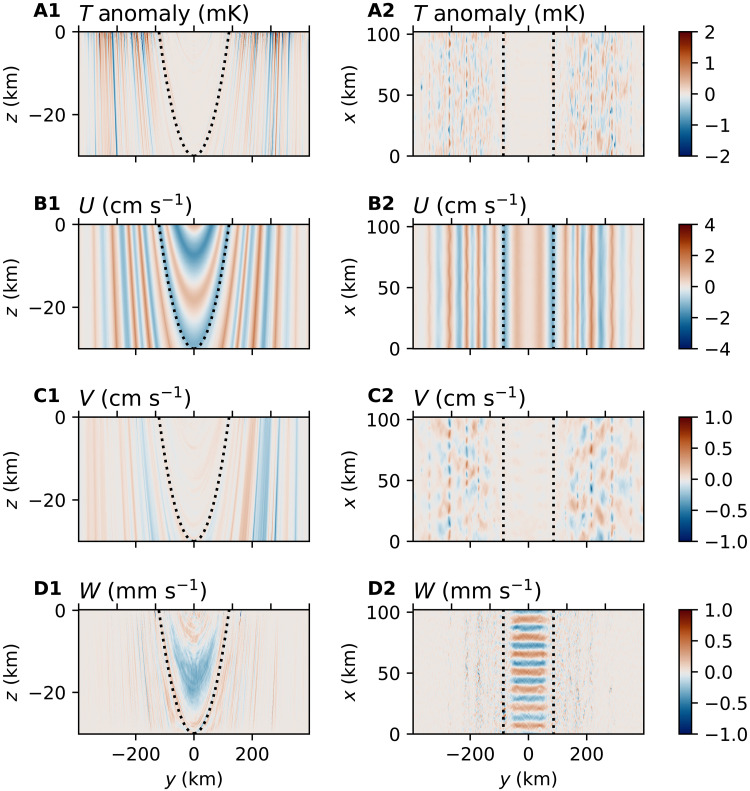
Fig. 3. Zonal jets and baroclinic eddies in the reference simulation.
The column on the left shows the instantaneous (A1) temperature anomaly, (B1) zonal velocity, (C1) meridional velocity, and (D1) vertical velocity along a zonal cross section. Here, the anomaly is defined as the instantaneous departure from the zonal mean. The column on the right (A2 to D2) shows the same fields on a horizontal cross section, which is at the depth of 15 km, halfway down the water column. The black dotted lines represent the tangent cylinders.

