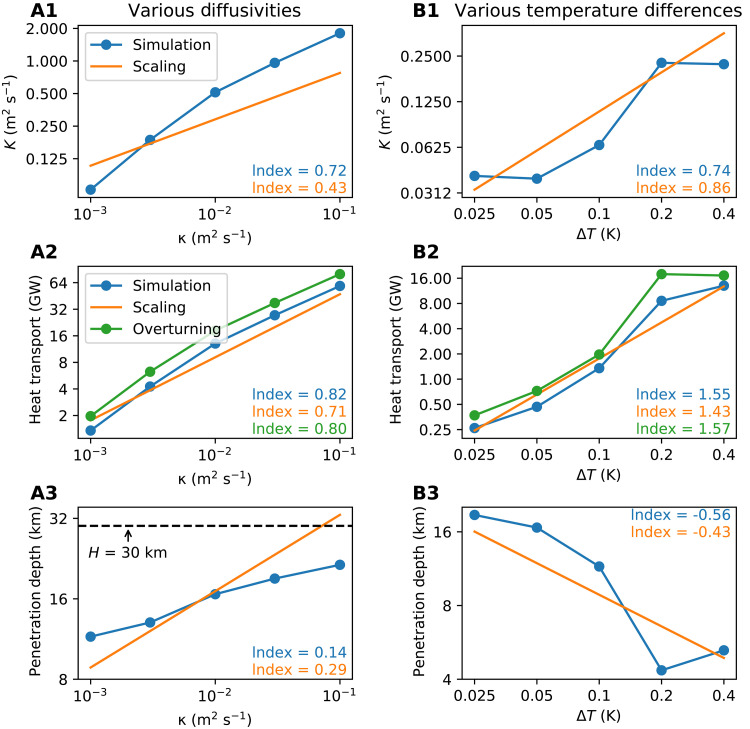
Fig. 6. Measures of key flow parameters in two groups of simulations compared to predictions from scaling.
The left column shows the (A1) eddy heat transport coefficient K, (A2) meridional heat transport, and (A3) penetration depth in calculations in which the vertical diffusivity, κ, is varied; the right column (B1 to B3) shows the same but when the prescribed temperature difference is varied. Theoretical predictions are made from Eqs. 23, 24, and 25. The overturning [green lines in (A2) and (B2)] represents the meridional heat transport calculated from streamfunction (Eq. 9). The index for the best power fit for each curve is shown in every panel with the corresponding color.

