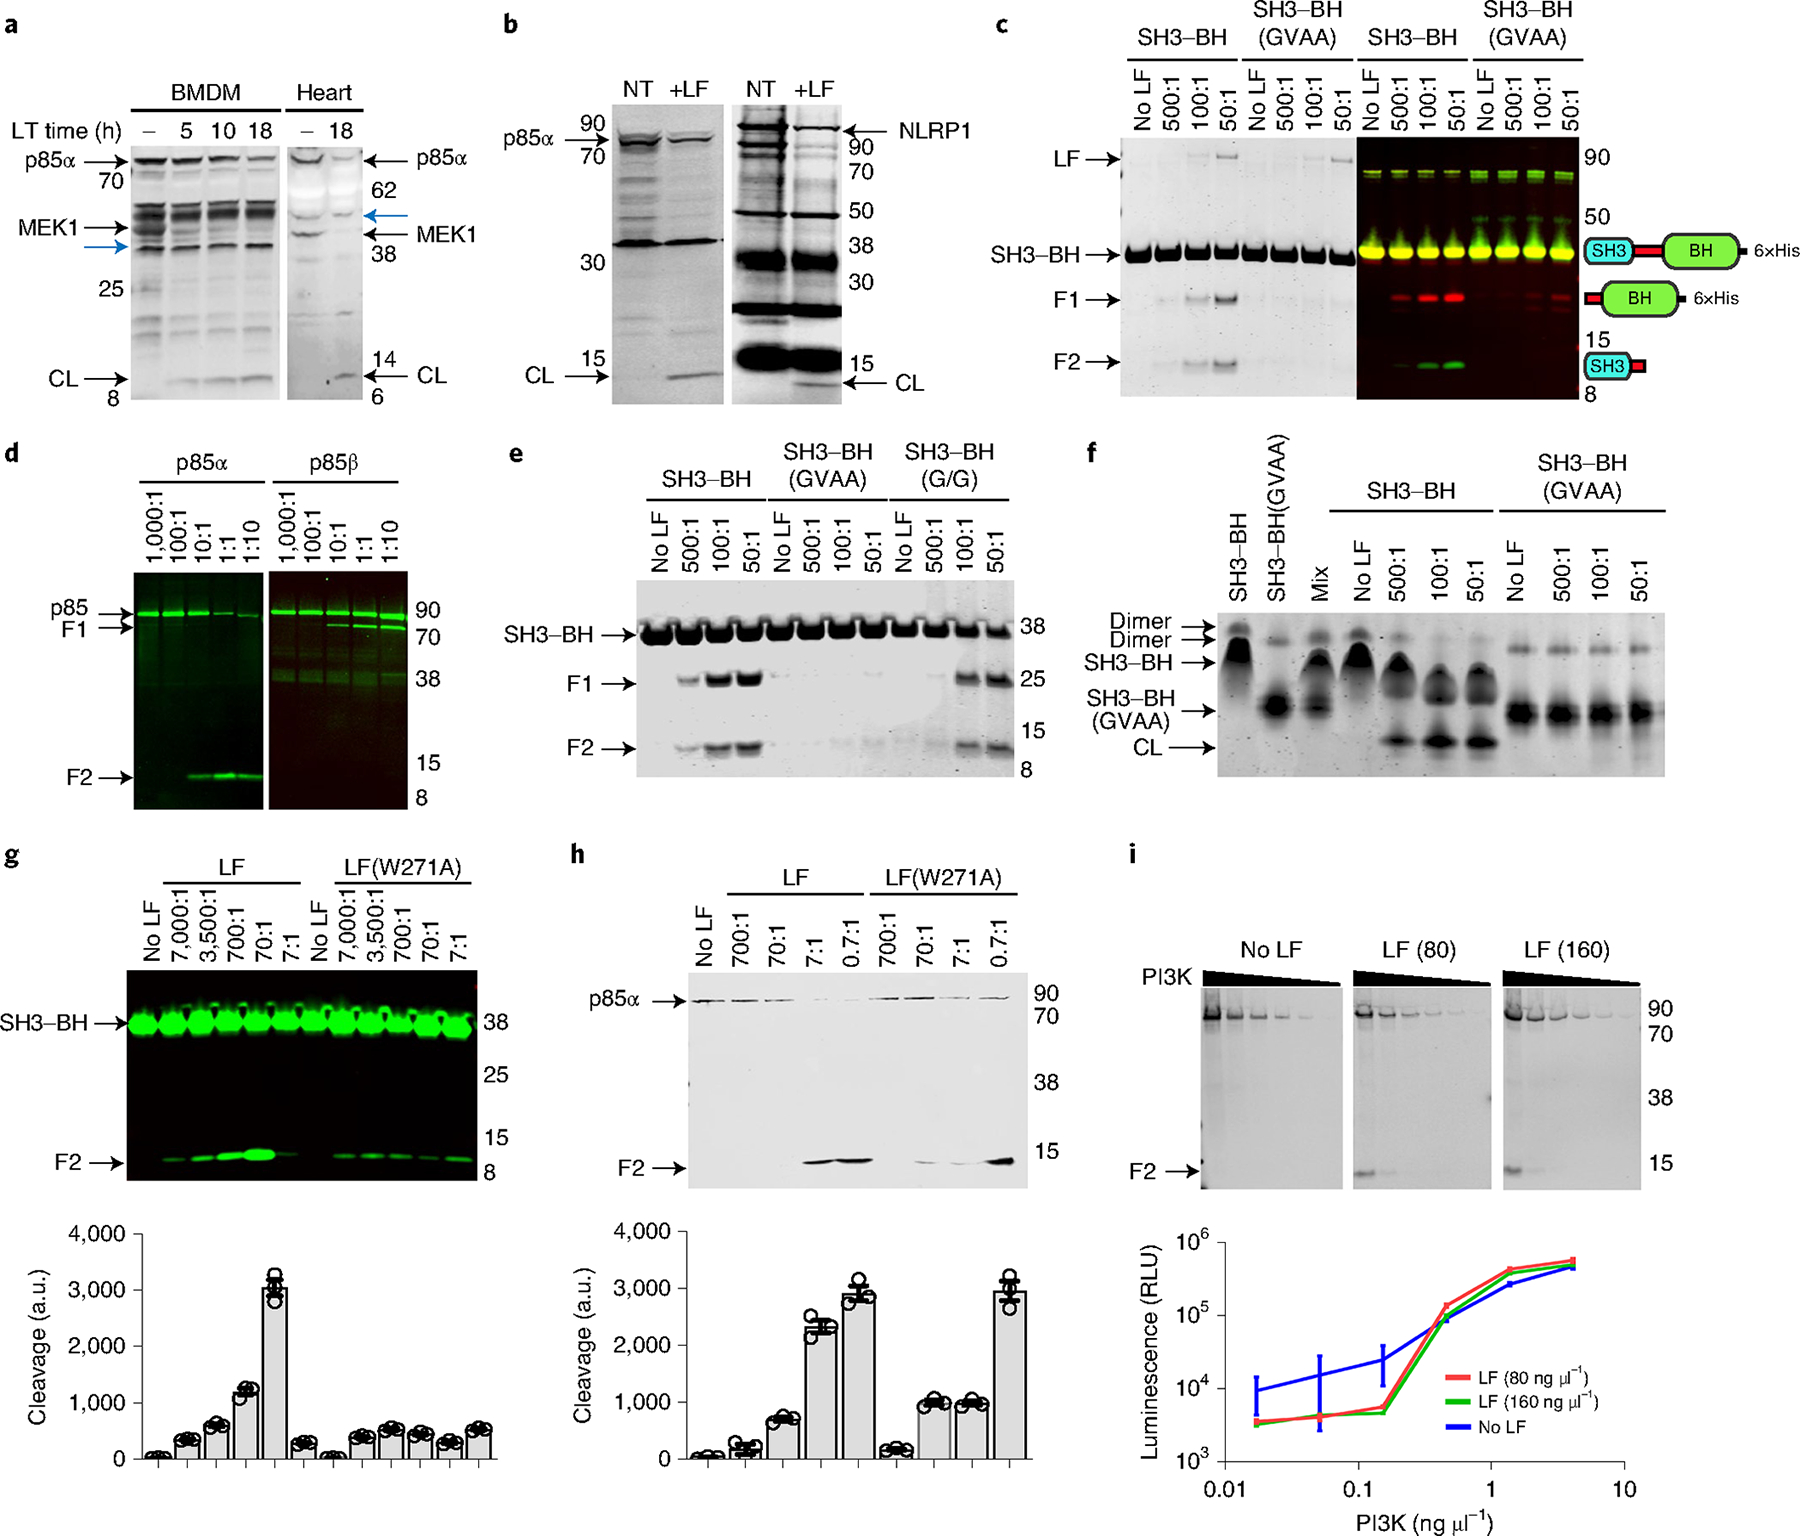
Fig. 2 |. p85 proteins are cleaved by LF.

a, Cleavage of p85α and MeK1 in C57BL/6J BMDMs treated with LT (1 μg ml−1) or hearts from LT-challenged mice (35 μg, intravenous, 18 h). Western blots use antibodies against the N terminus of MeK1 or p85, and loss of reactivity indicates cleavage. CL, cleavage product. Cross-reactive bands (blue arrowheads) show equal protein loading. b, Cleavage of HA-tagged human p85α (left) or rat NLRP1 (right). Cells were treated with LF (1 μg ml−1, 5 h (left) or 15 min (right)) and probed with p85 (left) or haemagglutinin (right) antibodies. NT, no-toxin control. c, Cleavage of recombinant SH3–BH with indicated molar ratios of LF (2 h, 37 °C), detected by Coomassie staining (left) or western blot (right). Antibodies to the N terminus of p85α (green) and a C-terminal His6-tag (red) generated in different species enabled sequential probing with secondary antibodies tagged with dyes with different wavelengths to identify the two LT-generated cleavage products. Domain arrangements of proteins or cleavage products are shown next to each migrating species. d, Cleavage of recombinant full-length p85α (left) or p85β (right) treated with LF (5 h, 37 °C) followed by western blot with an N-terminal p85α or C-terminal p85β antibody. e, Cleavage of recombinant SH3–BH, SH3–BH(GVAA) and SH3–BH(G/G) with indicated molar ratios of LF, as in c. f, Native gel electrophoresis of LF-treated SH3–BH or SH3–BH(GVAA) recombinant proteins indicating homodimer loss following LF cleavage. Mixture of the differentially charged wild-type and mutant protein variants is shown to demonstrate the relative mobility of each monomeric species. g,h, Cleavage of recombinant SH3–BH (g) and full-length p85α (h) by LF(W271A) and LF (5 h, 37 °C). Densitometry (mean ± s.d., n = 3 scans) shown for each cleavage product in bar graphs below gels. each bar corresponds to the lane above. i, LF (2.5 h, 37 °C; concentration in ng μl−1) cleavage of active recombinant PI3K p110–p85α complex and associated enzyme activities in LT-treated samples (graph, mean ± s.d., n = 4 readings, 2 independent replicates). There is no statistical significance between LT-treated and untreated curves (unpaired t-test, P = 0.73 and 0.8774). Positions of molecular weight markers are indicated in a–e,g–i. In c–e,g–i, F1 indicates the C-terminal cleavage product and F2 indicates the N-terminal cleavage product for the shown reaction. a.u., arbitrary units; RLU, relative luminescence units. In all panels, F1 indicates the C-terminal cleavage product and F2 the N-terminal cleavage product for the shown reaction.
