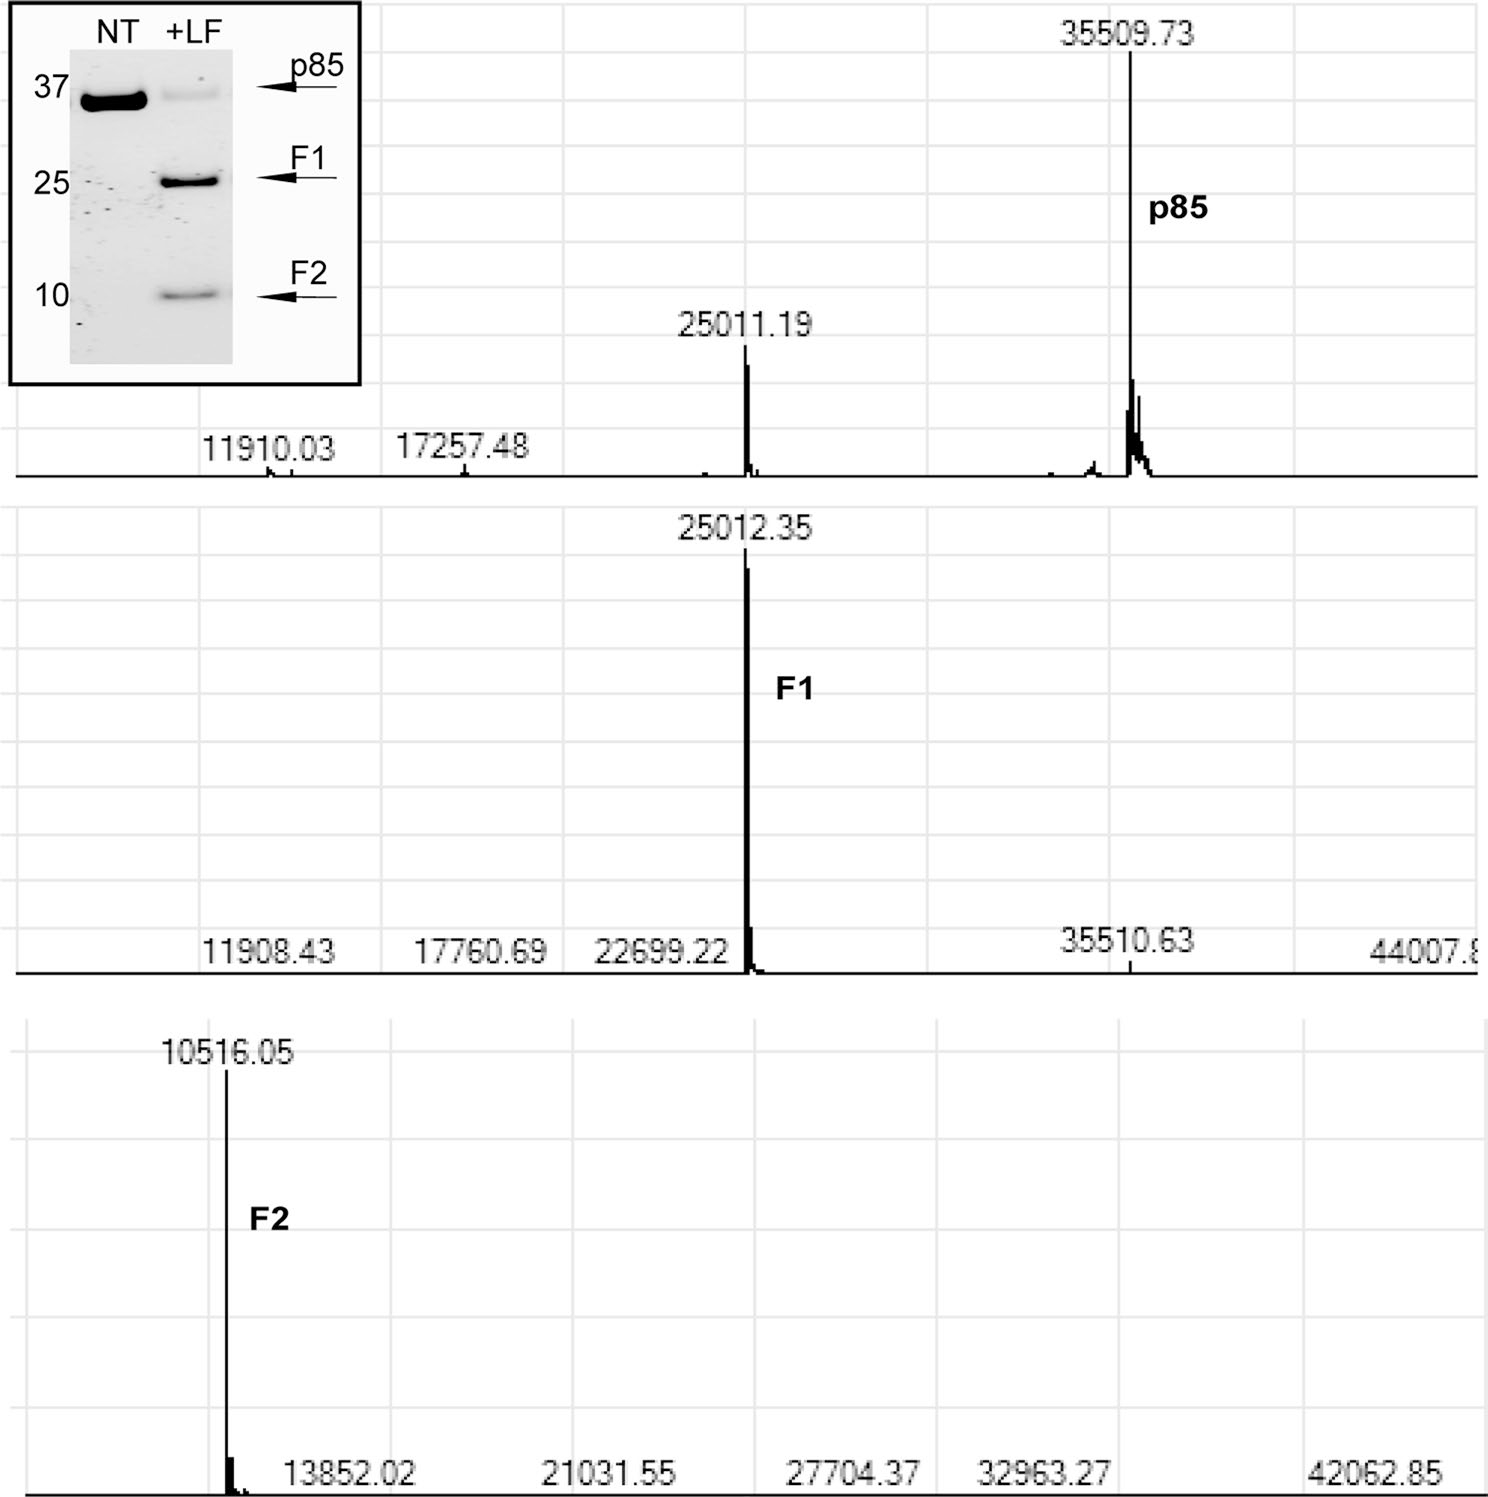
Extended Data Fig. 1 |. Mass spectrometry on LF-generated cleavage products.

SH3-BH protein was incubated with LF (molar ratio of 100:1, SH3-BH: LF) overnight at 37 °C. Mass spectrometry on cleavage products shown as F1 and F2 on gel yielded molecular masses labeled above each peak. Top graph shows molecular mass of uncleaved SH3-BH, middle graph shows molecular mass of F1 cleavage product, and bottom graph shows molecular mass of F2 cleavage product.
