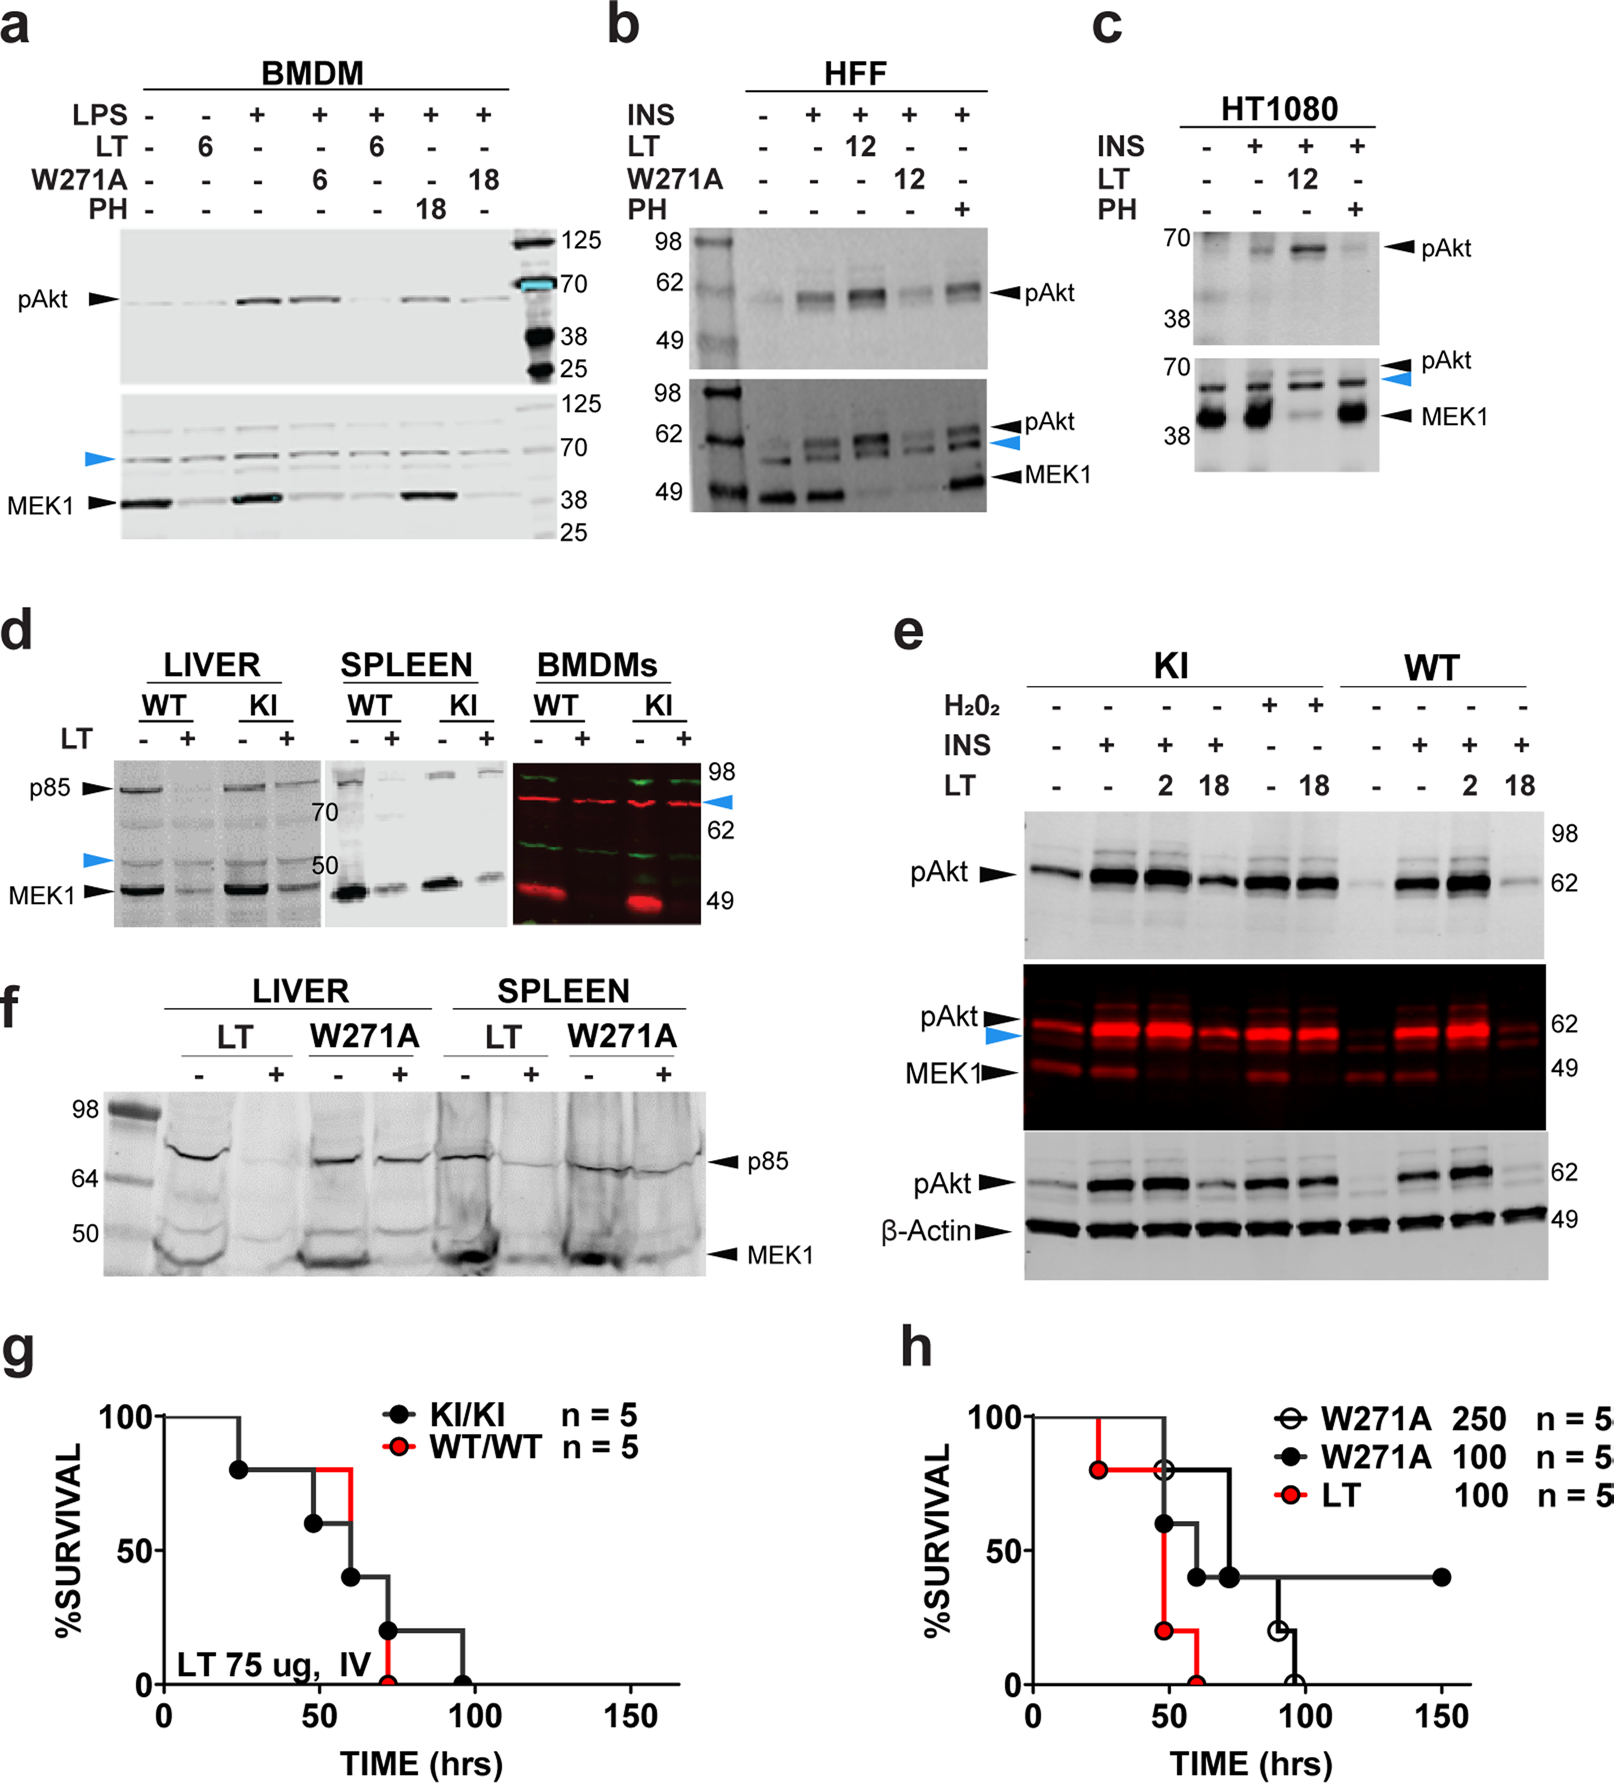
Extended Data Fig. 3 |. Signaling and survival consequences of LF cleavage.

a, C57BL/6J bone marrow-derived macrophages (BMDMs) were treated with LT or LTW271A (1 μg/ml) for indicated times, followed by LPS (1 μg/ml, 90 min). p38 inhibitor PH-797804 treatment was at 50 nM for 16 h, then at 100 nM for 1 h prior to LPS stimulation. Lysates were analyzed using antibodies to the N-terminus of MeK1 and re-probed with anti-pAkt (Thr308). b, c, Human foreskin fibroblasts (b) and HT1080 cells (c) were treated with LT (1 μg/ml, 12 h) prior to addition of insulin (200 nM, 45 min) and lysate analyses as in (a). d, Pik3r1GVAA/GVAA (KI) or wild-type (WT) mice were injected with LT (35 μg) and organs harvested at 24 h were analyzed for p85α and MeK1 cleavage. In the color panel, KI or WT BMDMs were treated with LT (1 μg/mL, 12 h). e, BMDMs were pre-treated with LT (1 μg/ml, 2 or 18 h), followed by stimulation with H2O2 (1 mM, 30 min) or insulin (200 nM, 45 min). Lysates were analyzed for pAkt, MeK1 cleavage, and actin. Top blot is initial probe with p-Akt (Thr308) antibody, middle gel is probe of same gel with MeK1 N-terminal antibody and lower gel is a third re-probe with anti β-actin, where β-actin runs with MeK1. f, Organs of mice challenged with mutant toxin LTW271A or LT (35 μg, IP, 18 h) were analyzed for p85α and MeK1 cleavage (g) KI mice and WT littermates were challenged with high dose LT (75 μg, IV) and monitored for survival. P-value comparing curves is 0.8114 by Log-rank test. h, C57BL/6J mice were challenged with LT (100 μg, IP) or LTW271A (100 μg or 250 μg, IP) and monitored for survival. P-value comparing LT (100 μg) to LTW271A (100 μg) is 0.0926, LT (100 μg) to LTW271A (250 μg) is 0.0128, and comparing the two LTW271A curves is 0.7301 (all by Log-rank test). Blue arrows in panels a-e point to cross-reactive bands which serve as internal equal loading controls. For densitometry quantifications see Supplementary Table 1.
