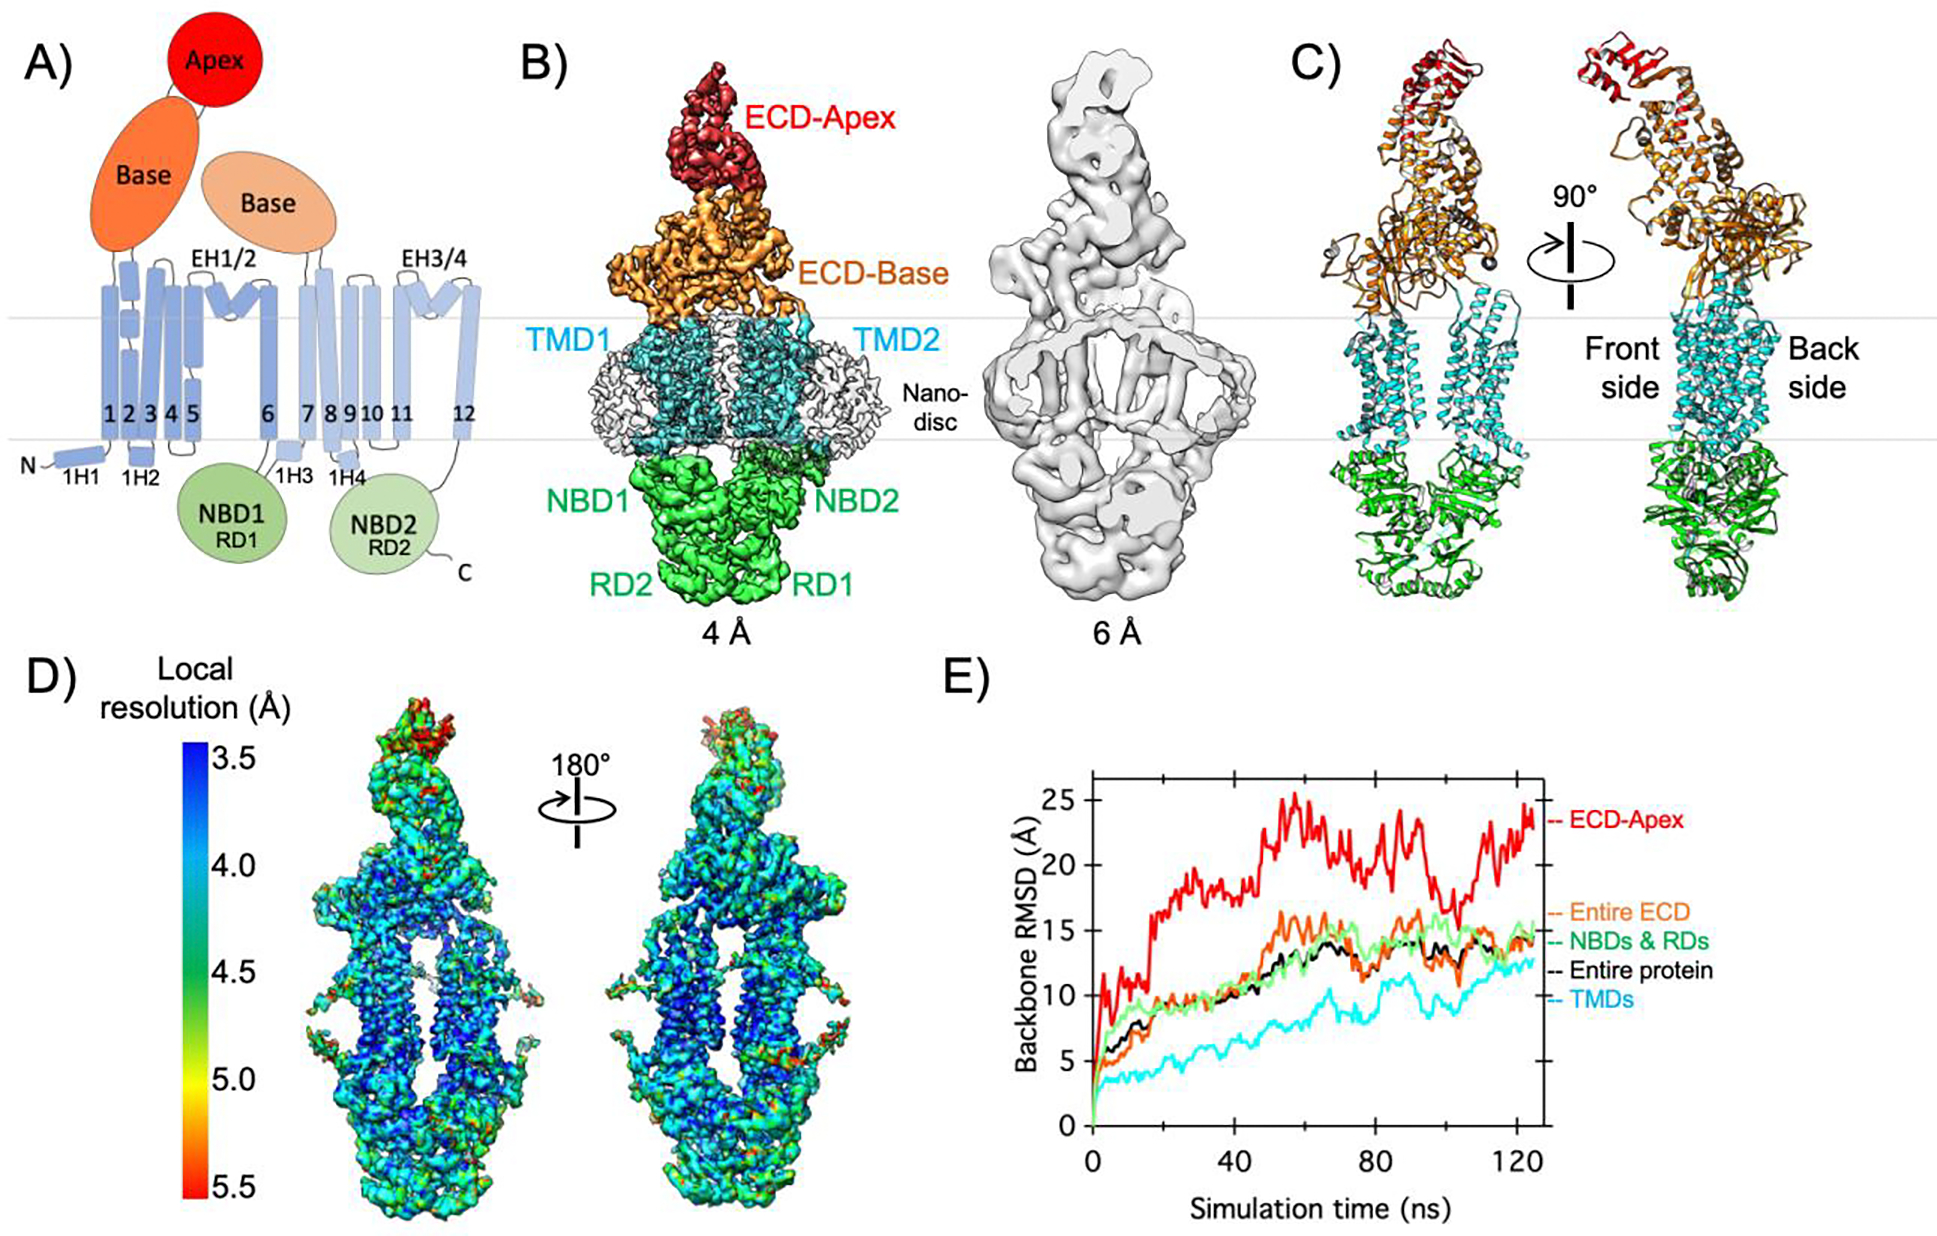
Figure 2. Cryo-EM structure and conformational dynamics of ABCA1 in a lipid bilayer.

A) The domain architecture and secondary structure of ABCA1 are indicated with the NBDs, TMDs, ECD base, and ECD apex shown in green, cyan, orange, and red, respectively. The boundaries of the inner membrane are indicated by gray lines. B) Side view of cryo-EM map of nanodisc-embedded ABCA1 low-pass filtered at 4.0-Å resolution, with different regions denoted and colored as in A and nanodisc shown as an outline (left). Cross-sectional side view of the same map low-pass filtered at 6.0-Å resolution, to highlight the nanodisc and membrane curvature (right). C) Two side views of the structural model of ABCA1, colored as in A. D) Local resolution of the cryo-EM map of nanodisc-embedded ABCA1. E) All-atom MD simulations of ABCA1 in a lipid bilayer reveal conformational changes. Backbone α-carbon root mean square displacement (RMSD) values are shown for different regions of ABCA1 and colored as in A. Briefly, two datasets collected on nanodisc-embedded ABCA1 were collected for combined processing and 3D reconstruction. All-atom MD simulations were completed on membrane embedded ABCA1 as described in the Supplemental Information.
