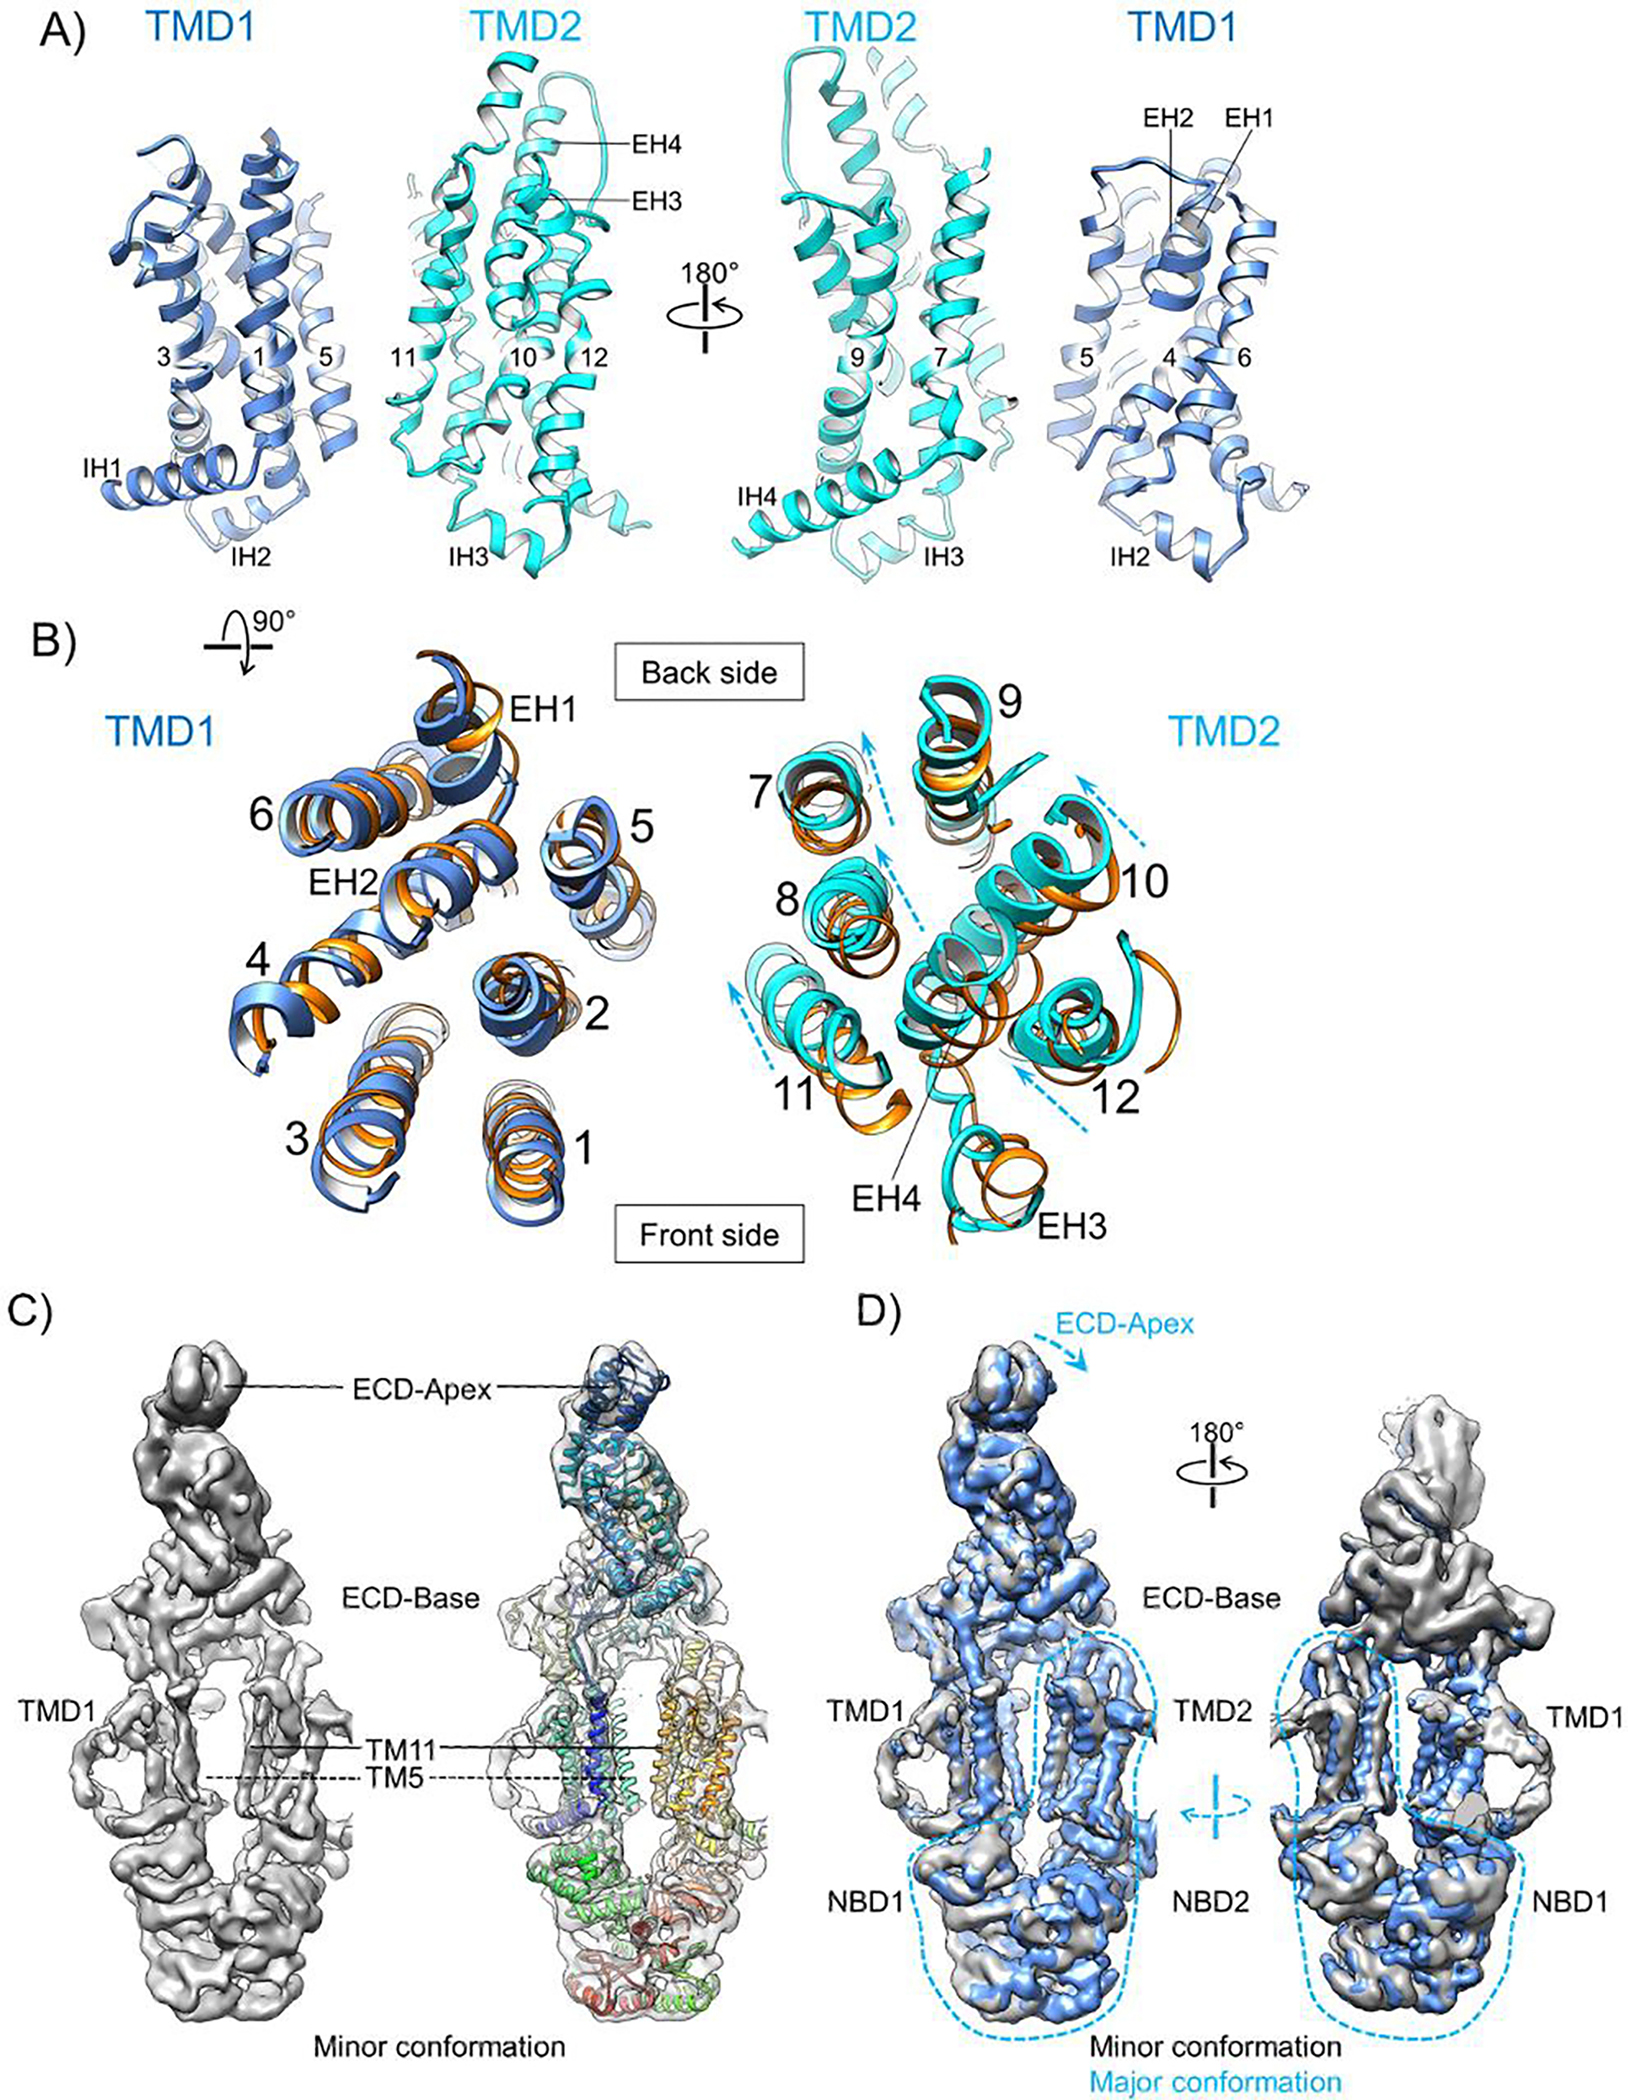
Figure 3. Conformation of the TMDs of nanodisc-embedded ABCA1.

A) Two side views of the TMDs (TMD1 in blue and TMD2 in cyan) with the transmembrane helices indicated by numbers and the other helices denoted. Left panel is the same view as in Fig. 1B and C (left). B) Top-down view of the TMDs. The lateral shifts of individual helices in TMD2 relative to their positions in the previously resolved ABCA1 digitonin conformation (PDB ID: 5XJY, orange) are indicated by dashed arrows. These two ABCA1 structures are aligned using TMD1. C) Side views of the cryo-EM map of nanodisc-embedded ABCA1 in the minor conformation and rigid-body fitting of the structural model of nanodisc-embedded ABCA1 in the major conformation (rainbow). The ECD-Apex and TM11 show clear discrepancies and TM5 is missing from the cryo-EM map, as indicated. D) Front and back side views of the superimposition between the cryo-EM maps of nanodisc-embedded ABCA1 in the major (blue) and minor (gray) conformations. Both maps are low-pass filtered to 4.4-Å resolution, sharpened with −100 Å2 b-factor, and displayed at 7σ contour level. The transitions from the minor to the major conformation in the ECD-Apex and TMD2-NBDs-RDs regions are indicated by blue dashed arrows.
