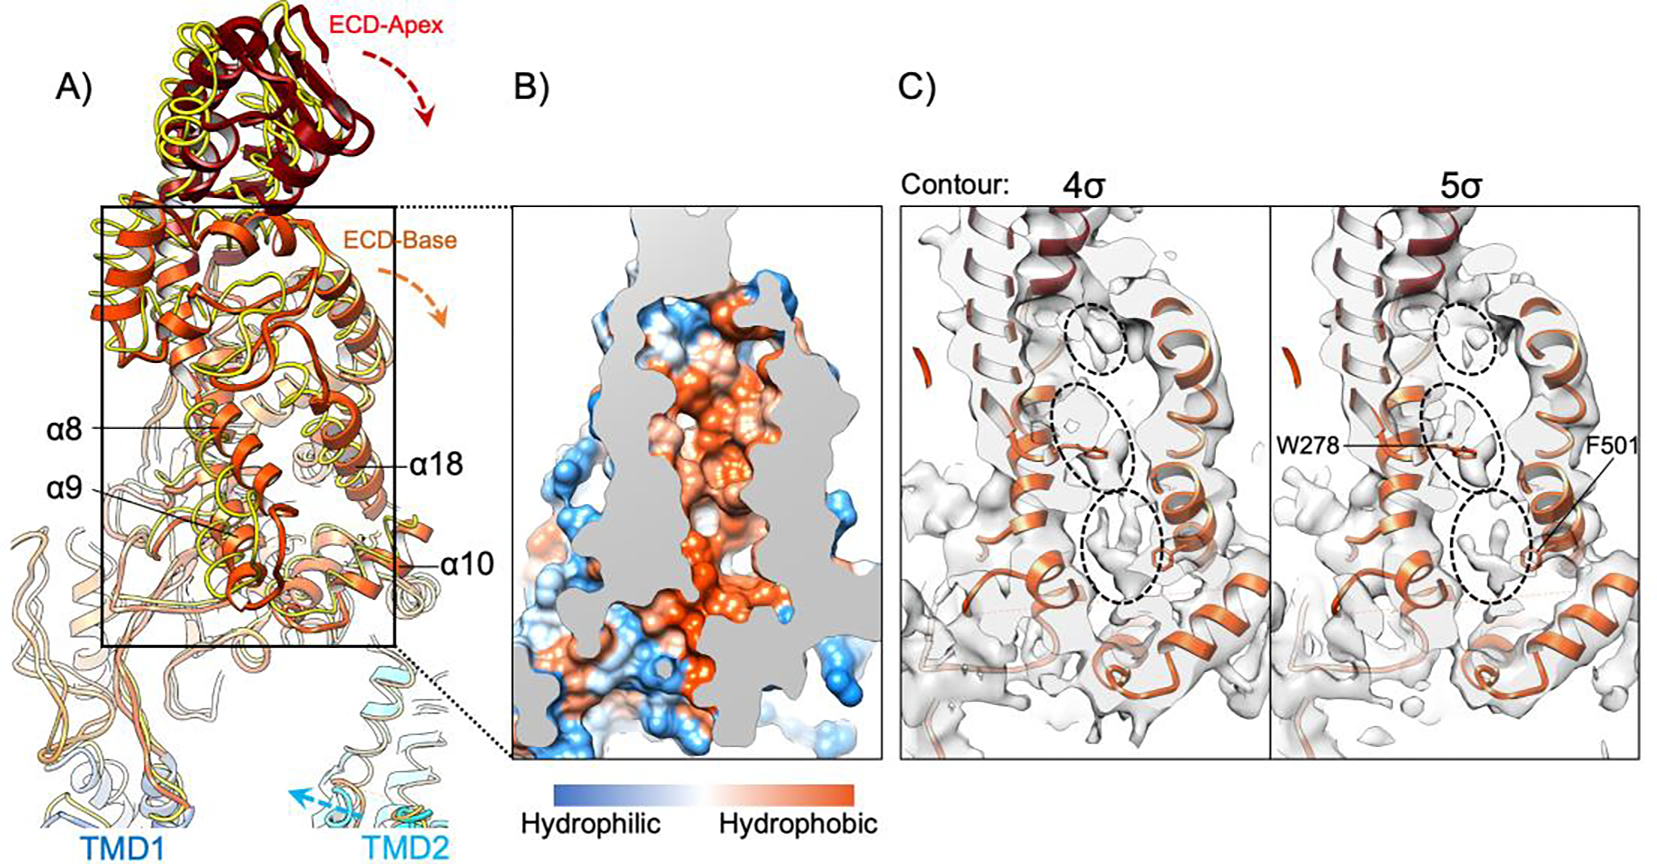
Figure 4. Conformational dynamics of the ECD and its large hydrophobic pocket.

A) Structural model of the ECD in the nanodisc-embedded ABCA1, viewed and colored as Fig. 1C (left) and superimposed with the ECD of ABCA1 in digitonin (PDB ID: 5XJY) (yellow wire). These two structures are aligned using their NBDs and RDs. The movements of TMD2, ECD base, and ECD apex of nanodisc-embedded ABCA1 relative to the ABCA1 in digitonin are indicated by dashed arrows. The important helices to form the hydrophobic pocket in the ECD base are denoted. B) Cross section of the boxed region in A, shown in hydrophobic surface representation. C) Cross section of the boxed region in A, showing superimposition of the structural model of nanodisc-embedded ABCA1 with its cryo-EM map displayed at two different contour levels. Three non-proteinaceous densities are indicated in dashed ovals. Trp278 and Phe501 are in close contact with the non-proteinaceous densities and are denoted.
