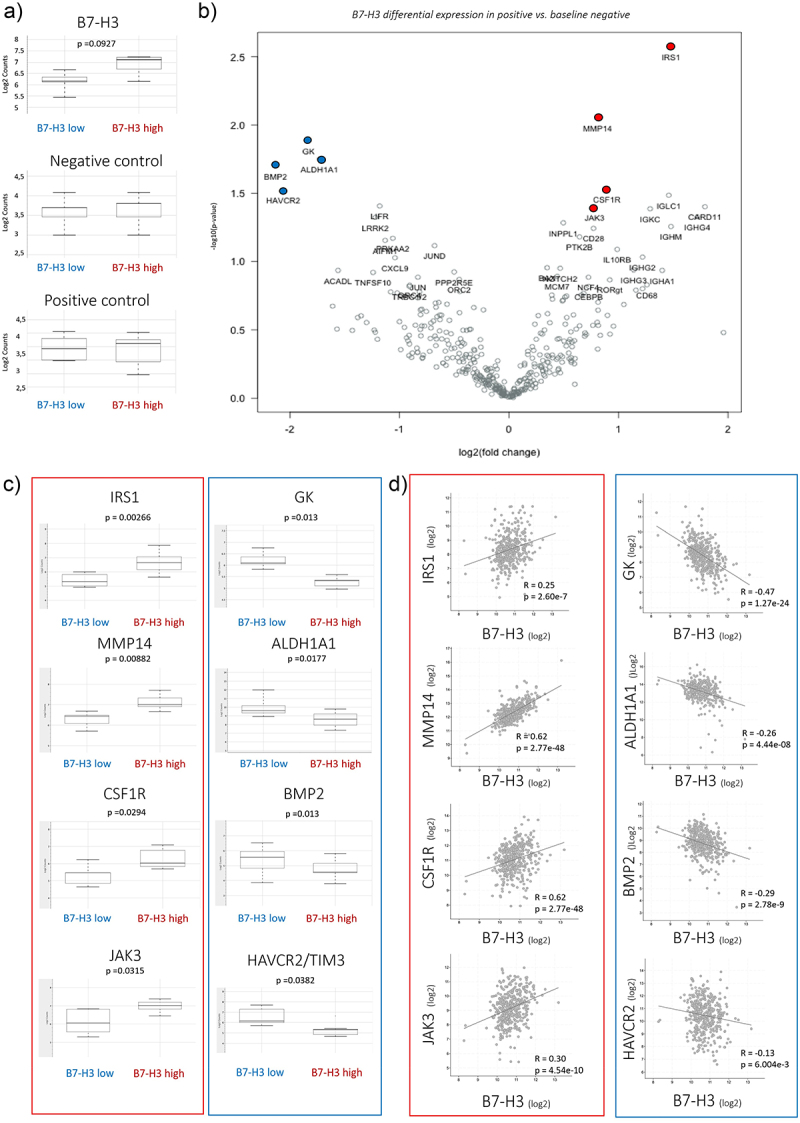
Figure 4.

Gene expression of B7-H3 in a panel of ccRCC samples.
a) Gene expression of B7-H3 in a panel of ccRCC samples showed higher B7-H3 mRNA expression in IHC-scored B7-H3 high tumors vs. B7-H3 low tumors. No differences were observed in negative and positive controls. b) Volcano plot of B7-H3 differential expression in positive vs. baseline negative. Volcano plot displaying each gene’s −log10 (p-value) and log2 fold change with the selected covariate. The 40 most statistically significant genes are labeled in the plot. Genes also showed in Figure 4c are colored: top 4 higher expression in B7-H3 high tumor samples (IRS1, MMP14, CSF1R and JAK3) in red and top 4 lower in B7-H3 high tumor samples (GK, ALDH1A1, BMP2, and HAVCR2/TIM3) in blue. c) Gene expression of up- and down-regulated genes. Up-regulated genes in B7-H3 high tumors are shown in red box: IRS1, MMP14, CSF1R and JAK3; and downregulated genes in blue box: GK, ALDH1A1, BMP2 and HAVCR2/TIM3. Values are in log2 scale. d) B7-H3 co-expression analysis was identified from the ccRCC dataset from TCGA (Nature 2013; mRNA expression (log2); RNA Seq V2 RSEM; 417 samples) (32) using cBioportal (https://www.cbioportal.org/). R: Spearman, p values are included. All data are shown on log2.
