. 2024 Nov 1;13(1):2421750. doi: 10.1080/21623945.2024.2421750

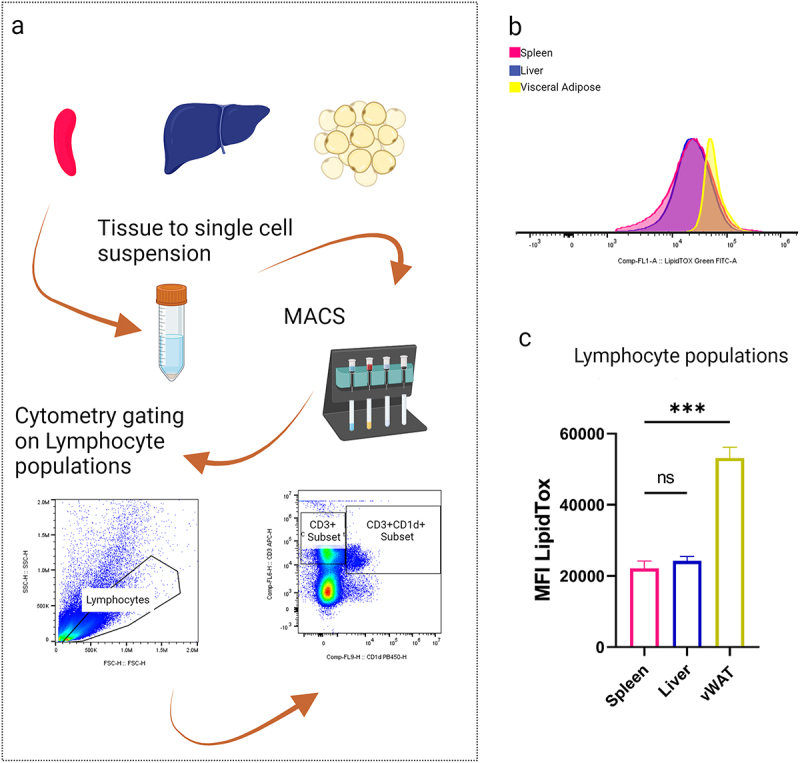
Figure 2.

Diagram illustrating the process of converting tissue to a single-cell suspension using MACS, followed by flow cytometry analysis of lymphocyte populations from spleen, liver and visceral adipose tissue. Includes a flow cytometry plot and a comparison graph of MFI LipidTox levels.

Ex-vivo gated lymphocytes show a lipid loaded phenotype.

(a) Representative histogram of lipid stained lymphocyte populations from spleen, liver and vWAT. (b) MFI of lipid stained lymphocyte populations (ns p > 0.05, *p < 0.05, **p < 0.01, ***p < 0.001, ****p < 0.0001), n = 3.