. 2024 Nov 6;10(11):001311. doi: 10.1099/mgen.0.001311

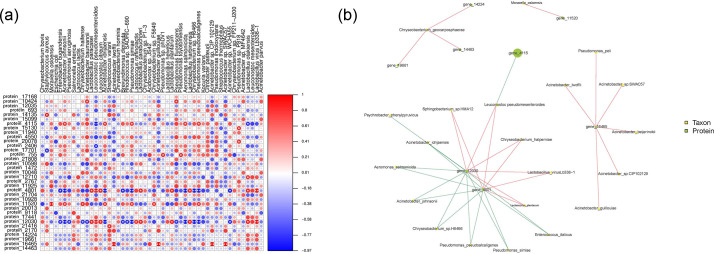
Fig. 5. Correlogram analysis of identified proteins and bacteria. (a) Association of heat-map analysis. Mantel test was conducted on a sample group level (a and b) to emphasize the factors contributing to the statistically significant differences. Statistical significance is denoted by single and double asterisks representing P<0.05 and P<0.01, respectively. (b) Network diagram of correlation. The links connecting nodes illustrate correlation, wherein the red line denotes a positive correlation and the blue line denotes a negative correlation. The greater the number of connections lining up with a node, the more microflora information it is associated with. The size of the node area corresponds to the higher value of the species abundance/detection index represented by that node.

Fig. 5.