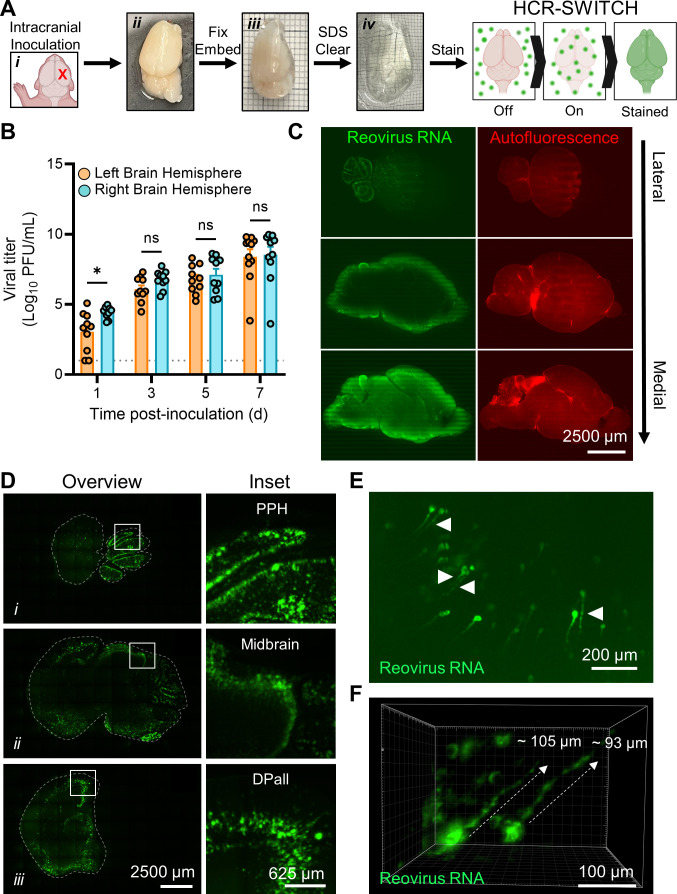
Fig 2.
Viral replication sites are detected throughout the brain in cleared, reovirus-infected brain hemispheres. (A–F) Two-day-old WT mice were inoculated IC with phosphate-buffered saline (mock) or 1,000 PFU of T3SA+. Mice were euthanized at 7 days post-inoculation, and brains were resected and hemisected along the latitudinal fissure. (A) Schematic of the approach to stain whole, cleared tissues using MiPACT, SWITCH, and HCR (MiPACT-SWITCH-HCR). The inoculation site is indicated with an X (i). Right-brain hemispheres were fixed with paraformaldehyde (ii), embedded in an acrylamide-based gel (iii), cleared using SDS (iv), and processed for the detection of viral RNA using the SWITCH-HCR approach. Minor gridlines in (iii) and (iv), 1 mm. Tissue in (iv) is partially immersed in refractive index-matching solution (RIMS). (B) Titers of the virus in homogenized hemispheres (right or left) were determined by plaque assay. Each symbol represents the viral titer from an individual animal. N = 10-11. Error bars indicate SEM. Values that differ significantly from the left-brain hemisphere by the mixed-effects model are indicated (*P < 0.05). ns, not significant. Dotted line indicates limit of detection. (C) Cleared, stained, and RIMS-submerged brain tissue was imaged in 3D using ribbon-scanning confocal microscopy. Data were processed using Imaris software (Oxford Instruments). Representative sagittal optical planes from a 3D-imaged brain data set depicting autofluorescence (right images, red) as a proxy for effective brain clearance or viral RNA signal (left images, green). Optical planes proceed from lateral (top) to medial (bottom) regions of the brain. Scale bars, 2,500 µm. (D) Representative sagittal optical planes from the 3D data set in panel (C) demonstrating reovirus-infected cells in different brain regions (i–iii). Left, brain (outlined by dashed line); right, enlarged inset boxed from the left image. Scale bars, 2,500 (whole-brain images) or 625 µm (insets). PPH, prepontine hindbrain; DPall, dorsal pallium. (E and F) Representative images from the 3D data set in panel (C) demonstrating reovirus-infected neurons in the brain. (E) Sagittal optical plane demonstrating reovirus RNA staining in viral factory-like patterns (arrowheads, globular structures). Scale bar, 200 µm. (F) Max projection reovirus RNA staining within axon-like extensions (dashed lines indicate approximate length). Scale bar, 100 µm.

