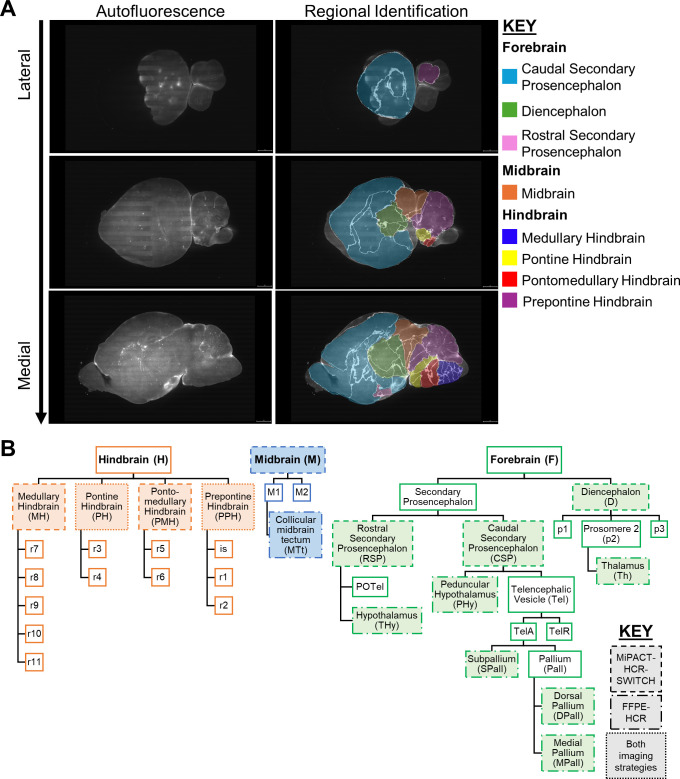
Fig 3.
Schematics detailing developing mouse brain atlas overlay and regional segmentation of cleared brains. (A and B) The 3D-reconstructed Allen Developing Mouse Brain Reference Atlas (P14) (31–33) was aligned and overlaid with reovirus-infected brain data sets using the brainreg Python package. Allen Developing Mouse Brain Reference Atlas, https://developingmouse.brain-map.org. (A) Representative sagittal optical plane images depicting autofluorescence from brain tissue (left column) alone or overlaid with the fitted model from the 3D-reconstructed Allen Developing Mouse Brain Atlas—P14 (right column) (31–33). Brain subregions are colored according to identity; see key for details. (B) Schematic describing relationships between brain regions and subregions used for imaging studies; see key for details.

