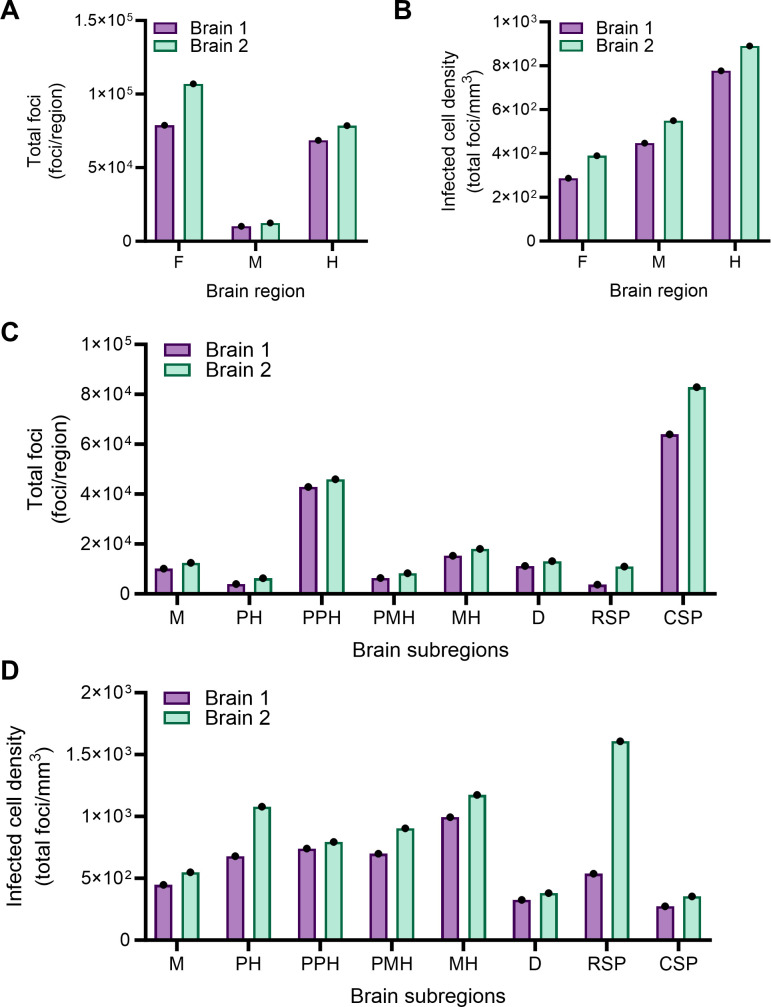
Fig 4.
Alignment of two reovirus-infected 3D brain data sets to a P14 mouse brain atlas indicates that most regions of the brain are susceptible to infection. (A–D) Two-day-old WT mice were inoculated IC with phosphate-buffered saline (mock) or 1,000 PFU of reovirus strain T3SA+. Mice were euthanized at 7 days post-inoculation, and brains were resected and processed by MiPACT-HCR as in Fig. 2. Brain 1 was imaged using ribbon-scanning confocal microscopy (purple bars), and brain 2 was imaged using MesoSPIM (green bars). Mock-inoculated samples stained for viral RNA showed no background staining. Data were processed using Imaris software (Oxford Instruments). The 3D-reconstructed Allen Developing Mouse Brain Atlas–P14 (31–33) was aligned and overlaid with reovirus-infected brain data sets using the brainreg Python package. Virus-infected cell bodies within subregions of the 3D data set were enumerated using the deepBlink tool modified on U-Net architecture followed by the DBSCAN clustering method. Data are presented as total infection foci (A and C) for different anatomical regions or infectivity density (total foci count per region volume based on alignment) (B and D) for different brain regions. Each bar indicates data from a single brain. F, forebrain; M, midbrain; H, hindbrain; PH, pontine hindbrain; PPH, prepontine hindbrain; PMH, pontomedullary hindbrain; MH, medullary hindbrain; D, diencephalon; RSP, rostral secondary prosencephalon; and CSP, caudal secondary prosencephalon.

