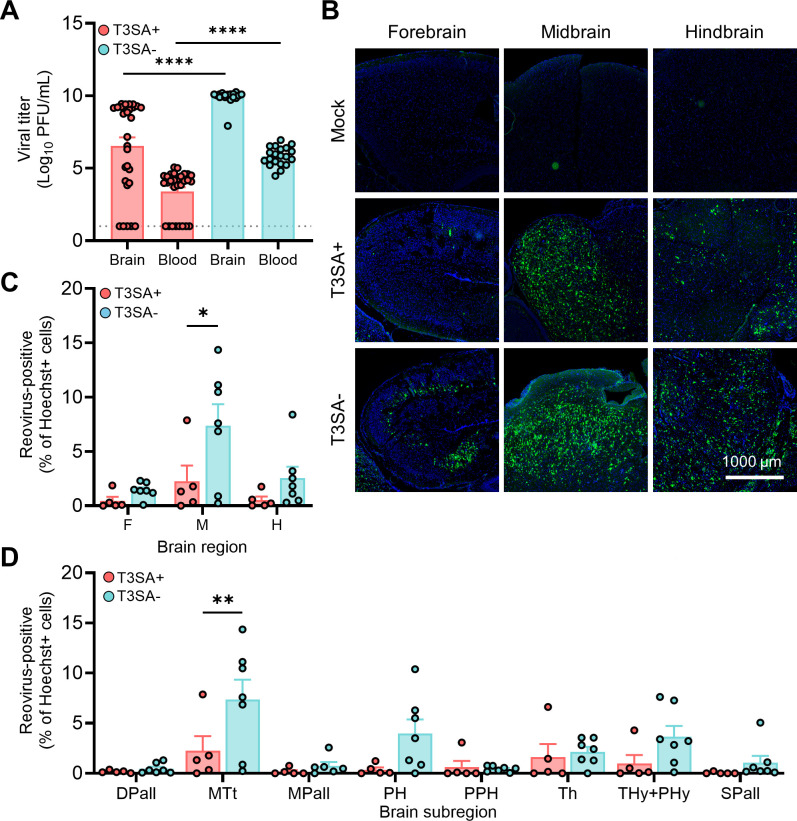
Fig 5.
Impaired reovirus binding to sialic acid does not limit infection of sites in the brain. (A–D) Two-day-old WT mice were inoculated IC with phosphate-buffered saline (mock) or 1,000 PFU of reovirus strain T3SA+ or T3SA−. Mice were euthanized at 7 days post-inoculation, and brain tissue and whole blood were collected. (A) Titers of virus in homogenized left-brain hemispheres and blood were determined by plaque assay. Each symbol represents the viral titer from an individual animal. Brain, N = 29/29 (T3SA+/T3SA−); blood, N = 19/20 (T3SA+/T3SA−). Error bars indicate SEM. Values that differ significantly from T3SA+ by unpaired t test are indicated (****P < 0.0001). Dotted line indicates limit of detection. (B–D) Right-brain hemispheres (with contralateral hemisphere viral loads between 3.4e8 and 7.3e9) were fixed with formalin, embedded in paraffin, and sectioned sagittally. Tissue sections were probed for reovirus RNA by HCR, counterstained with Hoechst dye, and imaged using a Lionheart FX automated imager. (B) Representative images are shown for the indicated brain regions. Reovirus RNA is depicted in green; nuclei are depicted in blue. Scale bar, 1,000 µm. (C and D) Reovirus infection in established regions of interest. Infection foci (HCR-positive) from each region (C) or subregion (D) of mock-infected and reovirus-infected sections were enumerated using the Spot Detector tool within Icy software. Data are presented as the percentage of infected cells, wherein a reovirus-positive cell was determined by signal intensity greater than background defined using a mock-infected brain. N = 5/7 (T3SA+/T3SA−). Error bars indicate SEM. Values that differ significantly from T3SA+ by Sidak’s multiple comparisons test are indicated (*P < 0.05 and **P < 0.005). DPall, dorsal pallium; MTt, collicular midbrain tectum; MPall, medial pallium; PH, pontine hindbrain; PPH, prepontine hindbrain; Th, thalamus; Thy+PHy, hypothalamus; and SPall, subpallium.

