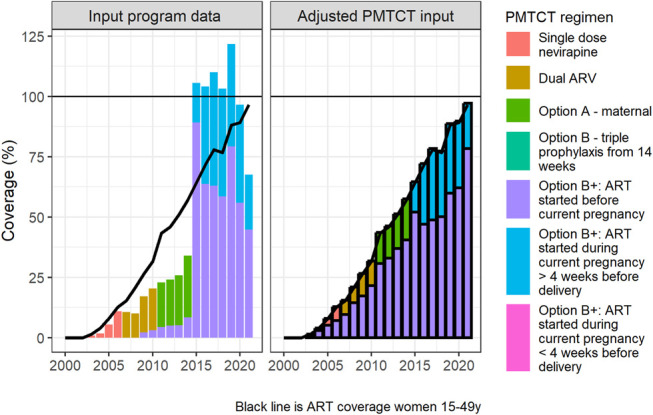
FIGURE 4.

Adjustment of PMTCT program data for Burkina Faso, shown as the implied percentage coverage relative to Spectrum-AIM estimated PWLHIV. Bars show estimated PMTCT coverage by regimen; the line shows ART coverage among all WLHIV 15–49 yrs for comparison. Left: using original PMTCT program data; right: adjustment to address outcomes of the alignment assessment (Fig. 1), as described in section S2 of Supplemental Digital Content, http://links.lww.com/QAI/C344, bold outlining indicates a modeled value.
