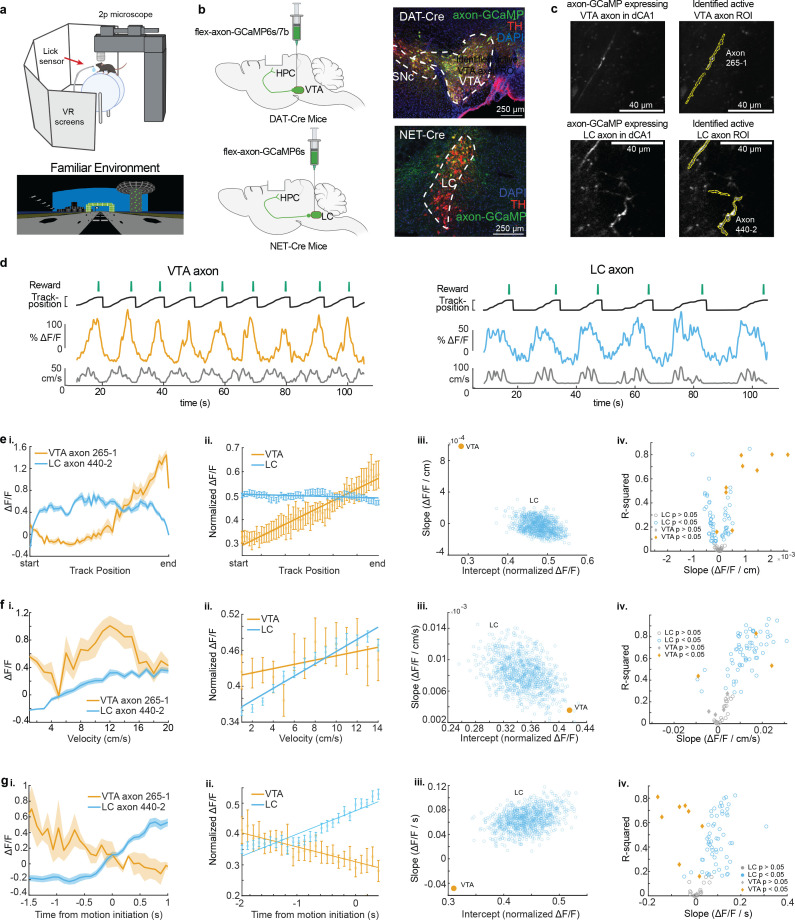
Figure 1. Distinct activity dynamics in ventral tegmental area (VTA) and locus coeruleus (LC) axons during navigation of familiar environments.
(a) Experimental setup (top), created with BioRender.com. Example virtual reality environment. (b) Schematic representation of injection procedure (left). Representative coronal brain sections immunostained for tyrosine hydroxolase (TH) from a DAT-Cre mouse showing overlapping expression of axon-GCaMP (green) and TH (red) in VTA neurons (top) and from a NET-Cre mouse showing overlapping expression of axon-GCaMP (green) and TH (red) in LC neurons (bottom). (c) Example CA1 field of view of VTA axons (top) and LC axons (bottom). Extracted regions of interest (ROIs) used for example VTA and LC activity throughout the figure. (d) Example DAT-Cre mouse (left) and NET-Cre mouse (right) with aligned reward delivery (top, green), mouse track position (black), from example ROI (VTA – orange, LC – blue), and mouse velocity (bottom, gray). (e, i) Position binned s.e.m in example VTA (orange) and LC (blue) ROIs during navigation of the familiar rewarded environment. (ii) Population average position binned s.e.m. in VTA ROIs (orange, n = 9 ROIs from 8 mice) and LC ROIs (blue, n = 87 ROIs from 27 sessions in 17 mice) . Linear regression analysis (on all data points, not means) shows that the population of VTA ROIs increase activity during approach of the end of the track while the population of LC ROIs have consistent activity throughout all positions. Linear regression, F test, VTA, , LC, . (iii) The LC dataset was resampled 1000× using n = 9 ROIs to match the number of VTA ROIs and the slope and intercept of the regression line were measured each time (blue dots). The VTA slope is steeper than all LC slopes indicating a stronger positive relationship between position and activity for VTA axons. (iv) Linear regression of position binned activity of individual VTA (orange diamonds) and LC (blue, circles) ROIs. The majority (8/9) of VTA ROIs show a significant positive relationship with position while LC ROIs show both a positive (25/87) and negative (37/87) relationship. (F, i) Same example ROIs as (d) binned by velocity. (ii) Same data as (d, ii,) binned by velocity. Linear regression shows that the population of VTA and LC ROIs have a significant relationship with velocity. Linear regression, F test, VTA, , LC, . (iii) Resampling shows the VTA slope and intercept is within the resampled LC slopes and intercepts indicating similar relationships with velocity. (iv) Linear regression of individual VTA and LC axons shows the majority (63/87) of LC ROIs have a significant positive relationship with velocity while only two VTA ROIs show this relationship. (g, i) Same example ROIs as (d) aligned to motion onset. (ii) Same data as (d, ii) aligned to motion onset. Linear regression shows that the population of VTA axons have a negative slope prior to motion onset while LC axons have positive slope. Linear regression, F test, VTA, , LC, . (iii) Resampling shows the VTA slope is negative while all resampled LC slopes are positive. (iv) Linear regression of individual VTA and LC ROIs shows the majority (56/87) of LC ROIs have a significant positive slope prior to motion onset while the majority (6/9) of VTA ROIs have a negative slope.


