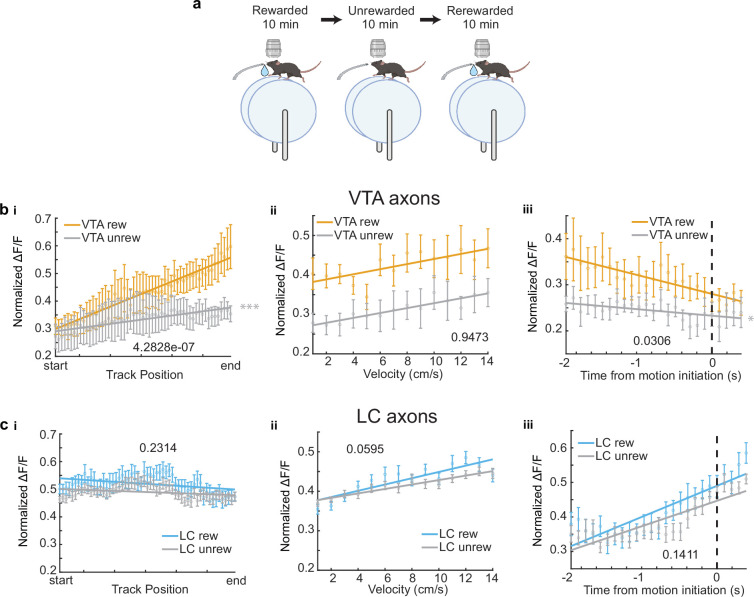
Figure 2. Removal of reward restructures ventral tegmental area (VTA) but not locus coeruleus (LC) input activity during spatial navigation.
(a) Experimental paradigm. (b, i) Population average position binned of VTA regions of interest (ROIs) (n = 6 ROIs in 6 mice) in the rewarded (VTA rew, orange) and unrewarded conditions (VTA unrew, gray). Linear regression, F test, Rewarded, , Unrewarded, . (ii) Same data as (b, i) binned by velocity. Linear regression, F test, Rewarded, , Unrewarded, . (iii) Same data as (b, i) aligned to motion onset. Linear regression, F test, Rewarded, , Unrewarded, . (c, i) Population average position binned s.e.m. of LC ROIs (n = 26 ROIs in 7 sessions in 4 mice) in the rewarded (LC rew, blue) and unrewarded conditions (LC unrew, gray). Linear regression, F test, Rewarded, , Unrewarded, . (ii), Same data as (c, i) binned by velocity. Linear regression, F test, Rewarded, , Unrewarded, . (iii) Same data as (c, i) aligned to motion onset. Linear regression, F test, Rewarded, , Unrewarded, . The slope of each unrewarded measure was compared to the familiar laps using a one-way ANCOVA with Tukey HSD post hoc test. *, ***. This figure was created with BioRender.com.

