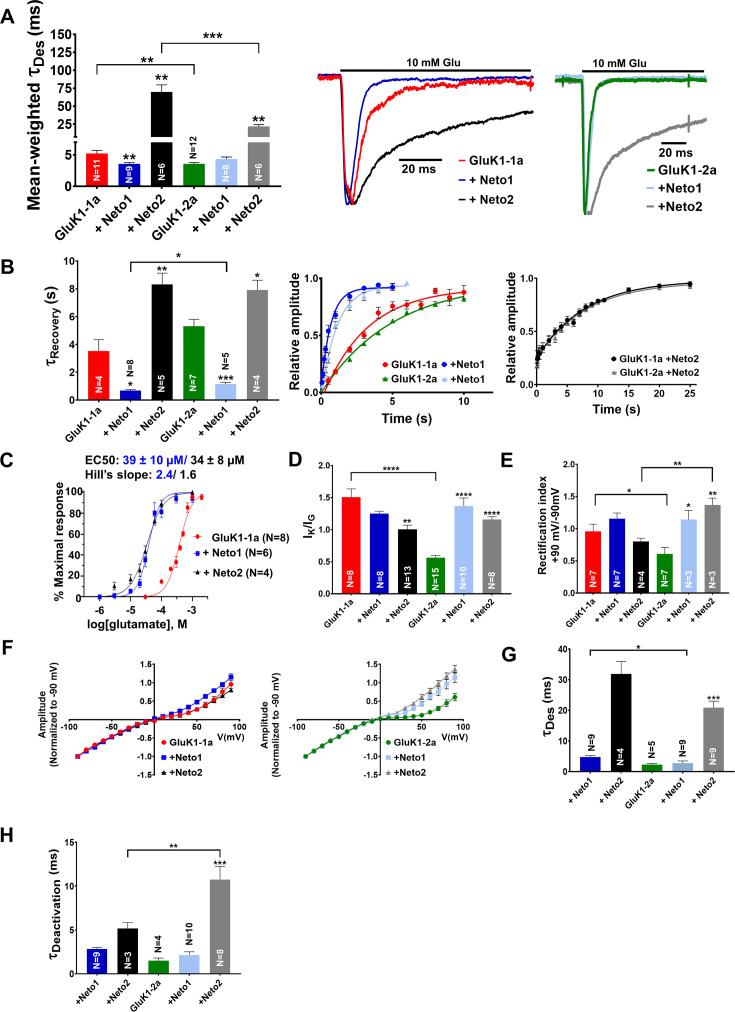
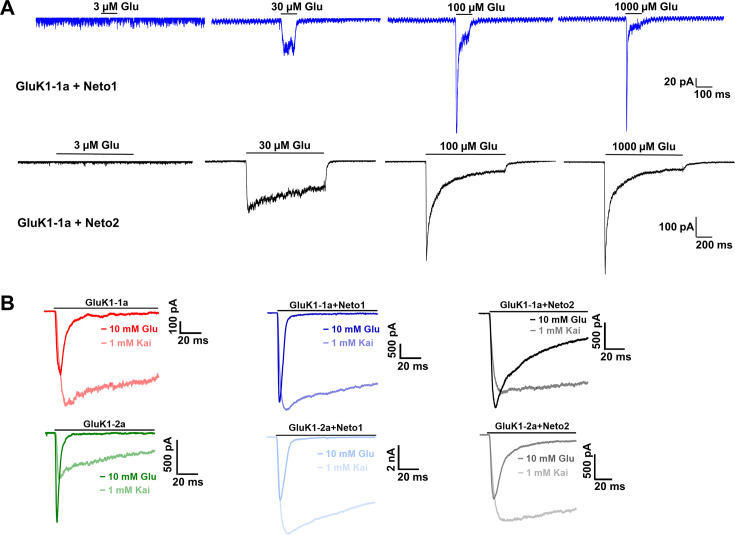
Figure 3. Amino-terminal domain (ATD) splice affects the functional modulation of GluK1 kainate receptors by Neto proteins.
(A) Shows mean-weighted Tau (τDes) values calculated at 100 ms for GluK1-1a (red) and GluK1-2a (green), respectively, with full-length Neto1 (blue/light blue) or Neto2 (black/gray), in the presence of glutamate. Representative normalized traces are shown for 100 ms application of 10 mM glutamate for HEK293 cells co-expressing GluK1-1a or GluK1-2a with Neto1 and Neto2. (B) Shows Tau (τRecovery) values plotted for GluK1-1a and GluK-2a, respectively, with full-length Neto1 or Neto2. Relative amplitude graphs for each receptor in the absence or presence of Neto proteins are also depicted. (C) Demonstrates the glutamate dose-response curves for GluK1-1a with Neto proteins. (D) Indicates the ratio of peak amplitudes evoked in the presence of 1 mM kainate and 10 mM glutamate for GluK1-1a or GluK1-2a with or without Neto proteins. (E) The ratio of currents evoked by the application of 10 mM glutamate at +90 mV and –90 mV for the receptors in the absence or presence of Neto proteins is shown. (F) Shows representative IV plots for GluK1-1a and GluK1-2a for the receptor alone versus with Neto proteins, respectively. Panels (G) and (H) show data recorded from outside-out pulled patches. (G) Displays desensitization kinetics for GluK1-1a (red) and GluK1-2a (green) with or without Neto proteins, respectively. (H) Shows deactivation kinetics at 1 ms for GluK1-1a (red) and GluK1-2a (green) with or without Neto proteins. Error bars indicate mean ± SEM, N in each bar represents the number of cells used for analysis, and * indicates the significance at a 95% confidence interval.


