. 2024 Nov 6;12:RP89755. doi: 10.7554/eLife.89755

Figure 6. Architecture of GluK1-1aEM reconstituted in nanodisc for SYM-bound desensitized state.

(A) Shows the segmented density map colored according to unique chains of the receptor tetramer (A- blue, B-pink, C-green, and D-gold) at 5.23 Å in side view and 90° rotated orientations. (B) Shows the final model fitted in the EM map. (C and D) Top views of amino-terminal domain (ATD) and ligand binding domain (LBD) layers. (E & F) Display the segmented map fitted with the corresponding distal (A & C) and proximal (B & D) chains. Receptor sub-domains, the position of splice insertion, and linkers are indicated.

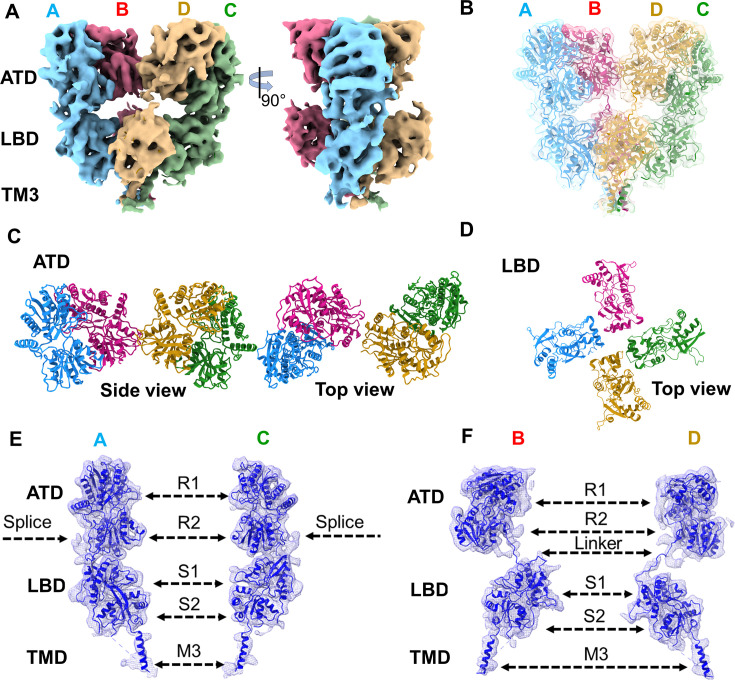
Figure 6.

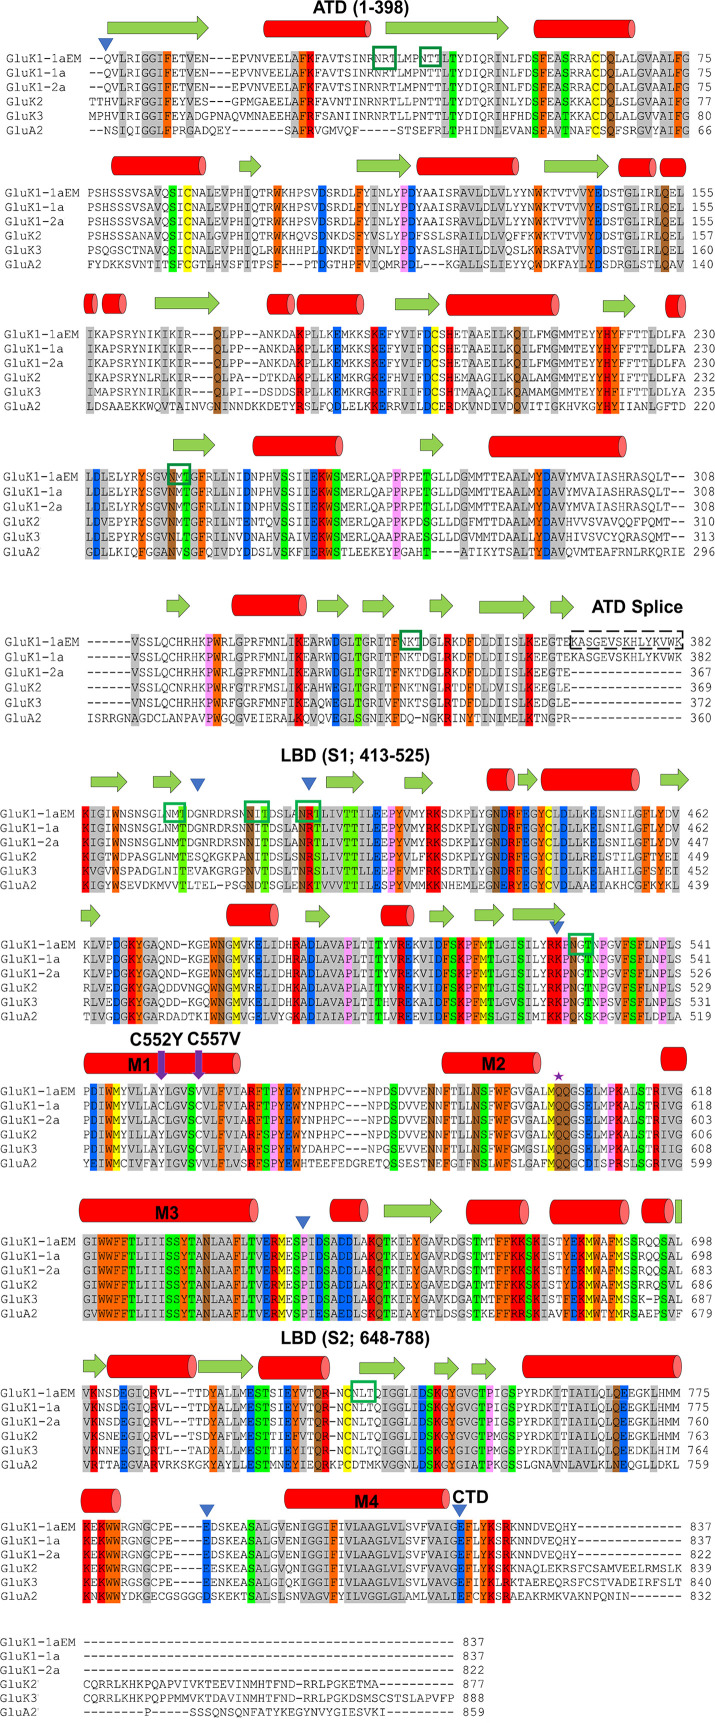
Figure 6—figure supplement 1. Sequence alignment and construct design of GluK1-1aEM.

Figure 6—figure supplement 1.

The EM construct was aligned with mature polypeptide sequences of wild-type (WT) rat GluK1-1a, GluK1-2a, GluK2, GluK3, and GluA2. The color scheme grouping was based on the similarity of residues, with gray (G, A, V, L, I), orange (F, Y, W), yellow (C, M), green (S, T), red (K, R, H), blue (D, E), brown (N, Q), and pink (P). The approximate domain boundaries and the residue numbers have been marked with blue inverted triangles and written in parenthesis. Green boxes mark predicted N-linked glycosylation sites (NXT). Purple arrows show cysteine mutations in the EM construct. The predicted secondary structure is shown above the sequence, with red cylinders for the α-helix and green arrows for the β-strand.
Figure 6—figure supplement 2. GluK1-1aEM construct design and purification.

Figure 6—figure supplement 2.

(A) Schematic representation of GluK1 splice variants present in the human brain along with a schematic for the GluK1-1aEM construct is shown. The N-terminal Signal Peptide (NSP; 1–34 residues), 15 amino acid splice insert in the amino-terminal domain (ATD), S1/S2 (ligand binding domain, LBD), M1-M4 (trans-membrane domain, TMD) and C-terminal thrombin site followed by EGFP and (His)8 tags. The star in the M1 region denotes the point mutation of free cysteines at positions 552 and 557; the numbering of residues is based on the mature polypeptide. (B) Superose 6 size exclusion chromatography profiles for the purified protein in detergent micelles and nanodisc, respectively, are shown, and the position corresponding to void, receptor tetramer, and empty nanodisc are indicated. SDS-PAGE gel images inset shows the undigested and thrombin-digested protein for GluK1-1aEM in detergent and MSP1E3D1 (green box) co-eluting with GluK1-1aEM (red box), revealing a stable protein-nanodisc complex, respectively. ND indicates receptors in lipid nanodiscs.
Figure 6—figure supplement 2—source data 1. Size exclusion chromatography data used for the plots.
Figure 6—figure supplement 2—source data 2. PDF files containing original SDS-PAGE gels for Figure 6—figure supplement 2B -inset 1 with rectangle indicating the cropping margin.
Figure 6—figure supplement 2—source data 3. Original uncropped SDS-PAGE gels for Figure 6—figure supplement 2B -inset 1.
Figure 6—figure supplement 2—source data 4. PDF files containing original SDS-PAGE gels for Figure 6—figure supplement 2B -inset 2 with rectangle indicating the cropping margin.
Figure 6—figure supplement 2—source data 5. Original uncropped SDS-PAGE gels for Figure 6—figure supplement 2B -inset 2.
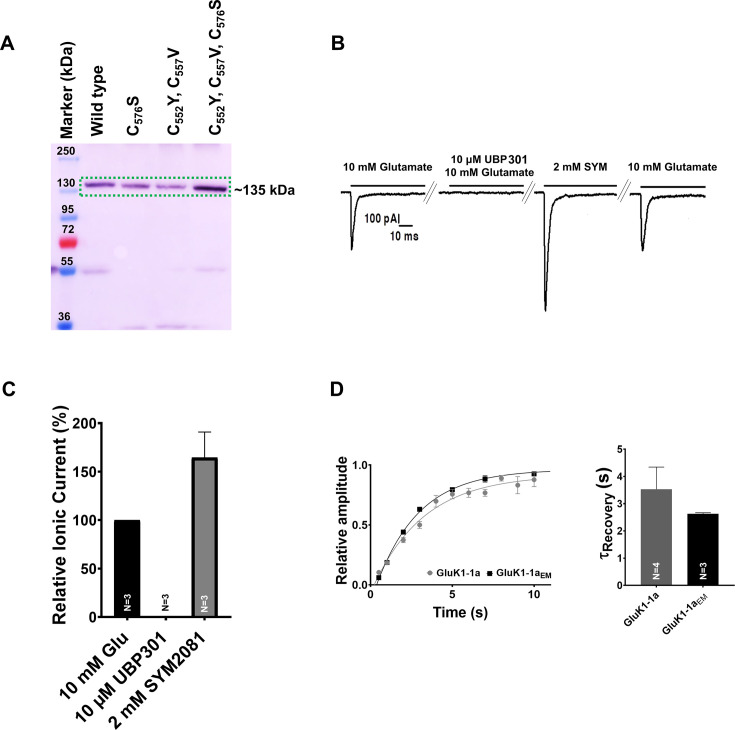
Figure 6—figure supplement 3. GluK1-1a construct optimization for structural studies and its gating properties.

Figure 6—figure supplement 3.

The optimized constructs were verified for expression. Here, three free cysteines mutations in the TM1 are represented as C576S (1 x Cys), C552Y, C557V (2 x Cys), and C552Y, C557V, C576S (3 x Cys). 2 x Cys (C552Y, C557V) mutant was used as GluK1-1aEM for structural studies. (A) Western blot probed with anti-His antibody (Cell Signaling Technology, USA) shows the expression of all the mutants with respect to the wild-type (WT) construct; the Expected size of the polypeptide is indicated (MW:~135 kDa). (B) Representative traces for whole-cell patch clamp recordings (36–48 hr post-infection) of HEK293 cells infected with GluK1-1aEM baculovirus is shown. The receptors showed activation by 10 mM Glutamate, blocked in the presence of the inhibitor 10 µM UBP301. Post-washing the reversible inhibitor, the receptor could undergo a similar activation and desensitization cycle in the presence of 2 mM SYM and 10 mM Glutamate. (C) Shows the graphical representation of the percentage of relative current in the presence of 10 µM UBP301, 2 mM SYM, and 10 mM glutamate. (D) Electrophysiology profiles confirm that the GluK1-1aEM construct behaves similarly to the wild-type GluK1-1a in terms of recovery from desensitization. Error bars indicate mean ± SEM, and N in each bar represents the number of cells used for analysis.
Figure 6—figure supplement 3—source data 1. Uncropped western blot with rectangle indicating the cropping margin.
Figure 6—figure supplement 3—source data 2. Original file for western blot displayed in Figure 6—figure supplement 3A.
Figure 6—figure supplement 3—source data 3. Data used for the electrophysiology plots in panels B-D.
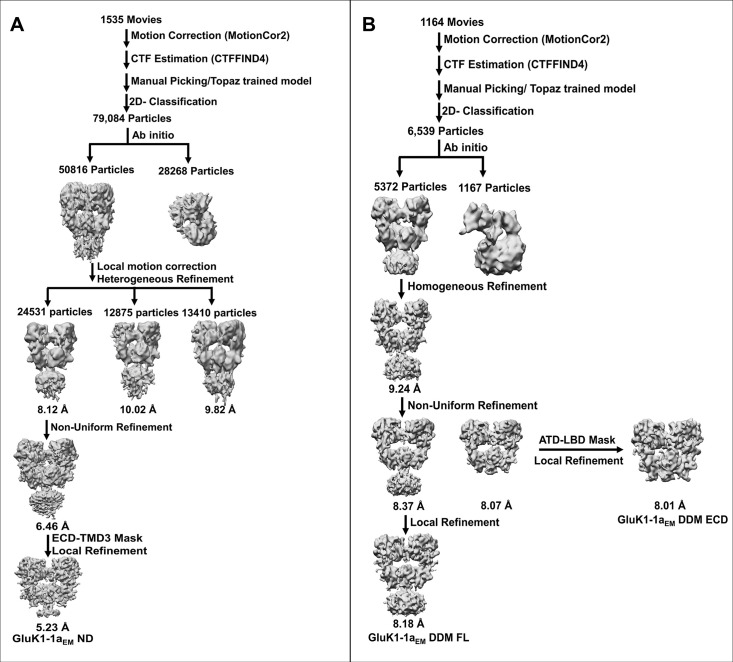
Figure 6—figure supplement 4. Single-particle cryo-EM data processing flow chart for GluK1-1aEM in nanodisc (ND) and detergent (DDM).

Figure 6—figure supplement 4.

(A) For the GluK1-1aEM ND dataset, 79,084 particles from the final 2D classification were used for initial 3D reconstruction into two classes to remove junk particles. Furthermore, the good 50,816 particles were polished using local motion correction, and the initial 3D map was heterogeneously refined into three classes. The best map (24531 particles, highlighted in red box) was subsequently refined using non-uniform refinement followed by local refinement using the ECD-TMD3 mask to attain the final density map (GluK1-1aEM ND) resolution of 5.23 Å at 0.143 FSC. (B) 6539 particles from the final 2D classification were used to determine ab initio 3D reconstruction of GluK1-1aEM DDM in 2 classes to remove broken particles. The 3D map was refined using good particles (5372, highlighted in red box) with homogenous refinement to obtain a resolution of 9.2 Å. Further, non-uniform refinement followed by local refinement was performed using full-length and extracellular domain (ECD = ATD + LBD) masks to get final resolutions of 8.2 Å (GluK1-1aEM DDM FL) and 8 Å (GluK1-1aEM DDM ECD), respectively.
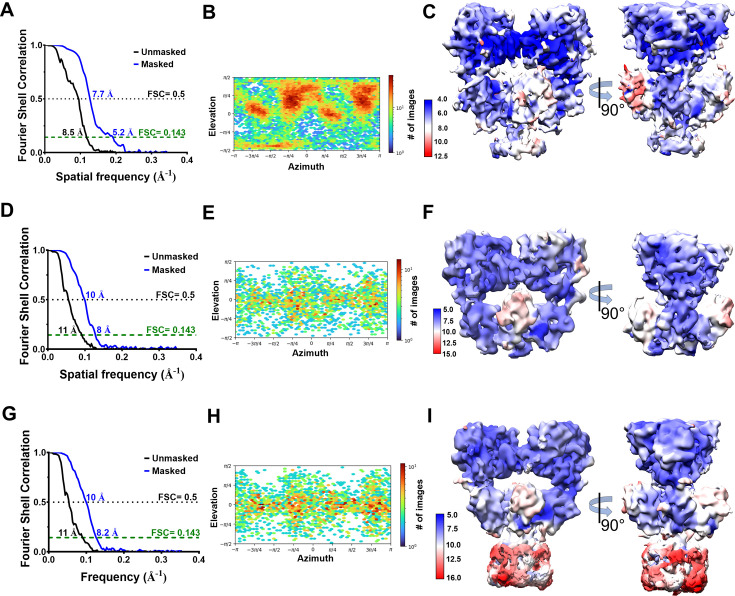
Figure 6—figure supplement 5. Estimation of resolution and particle distribution for GluK1-1aEM structures.

Figure 6—figure supplement 5.

(A, D, and G) Show Fourier Shell Correlation curves at 0.143 and 0.5 cut-offs for GluK1-1aEM ND, GluK1-1aEM DDM ECD, and GluK1-1aEM DDM FL reconstructions, respectively, for unmasked (black) and masked (blue) maps estimated in cryoSPARCv3.1. (B, E, and H) Show the angular distribution of particles for GluK1-1aEM ND, GluK1-1aEM DDM ECD, and GluK1-1aEM DDM FL maps, respectively, as produced by cryoSPARCv3.1. (C, F, and I) Show the local resolution estimates for GluK1-1aEM ND (4–12.5 Å), GluK1-1aEM DDM ECD (5–15 Å), and GluK1-1aEM DDM FL (5–16 Å) maps, respectively.
Figure 6—figure supplement 5—source data 1. Data for the FSC plots.
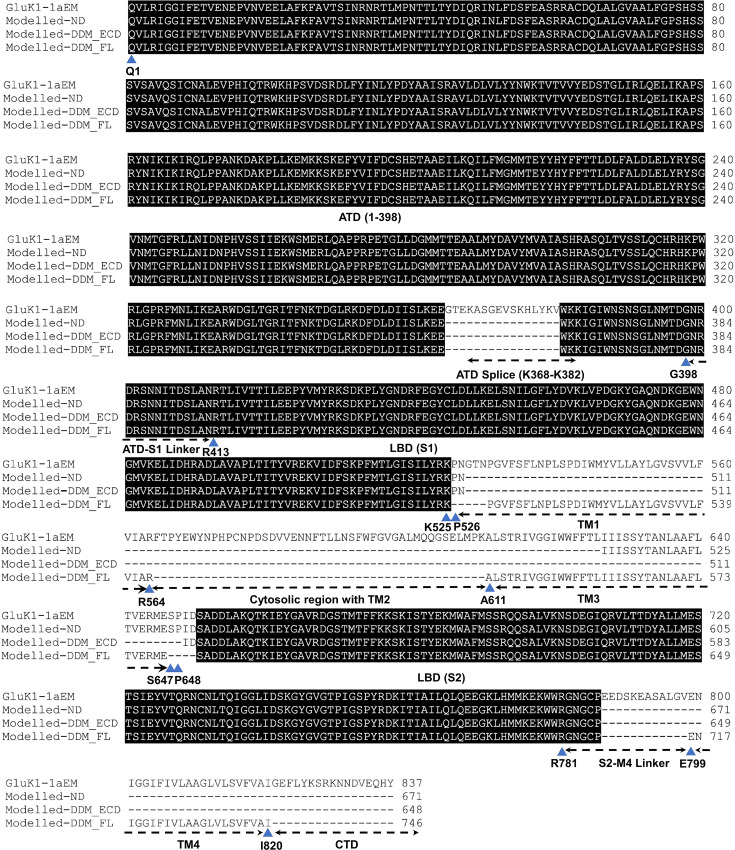
Figure 6—figure supplement 6. Sequence alignment for the three models presented in the study.

Figure 6—figure supplement 6.

Polypeptide chains modeled in the EM maps vs. the full GluK1-1aEM construct are shown. The beginning and ending residues of each modeled domain are indicated by blue triangles for GluK1-1aEM ND, GluK1-1aEM DDM ECD, and FL models. Missing residues are shown as dashed lines that could not be built due to resolution limitations.
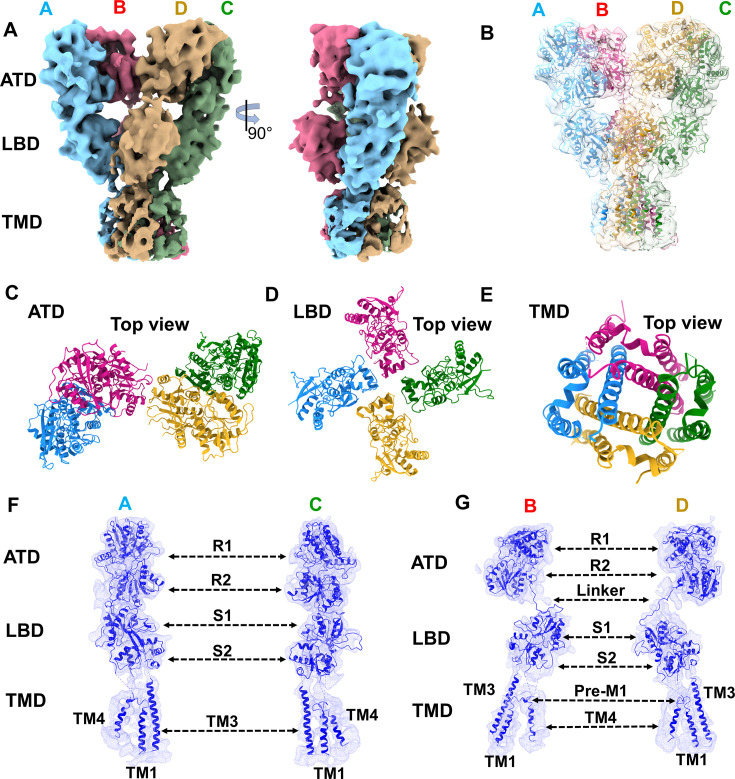
Figure 6—figure supplement 7. Cryo-EM map and model for GluK1-1aEM dodecyl-β-maltoside (DDM) FL-SYM complex.

Figure 6—figure supplement 7.

(A) Shows the front and side views of the segmented density map for the DDM solubilized GluK1-1a colored uniquely according to different chains. (B) Shows the atomic model fitted in the EM map. (C, D, and E) Show the top views of amino-terminal domain (ATD), ligand binding domain (LBD), and TMD layers. (F, G) Show the segmented map with fitted chains for each subunit, respectively. Sub-domains and helices of the TMD region are labelled.
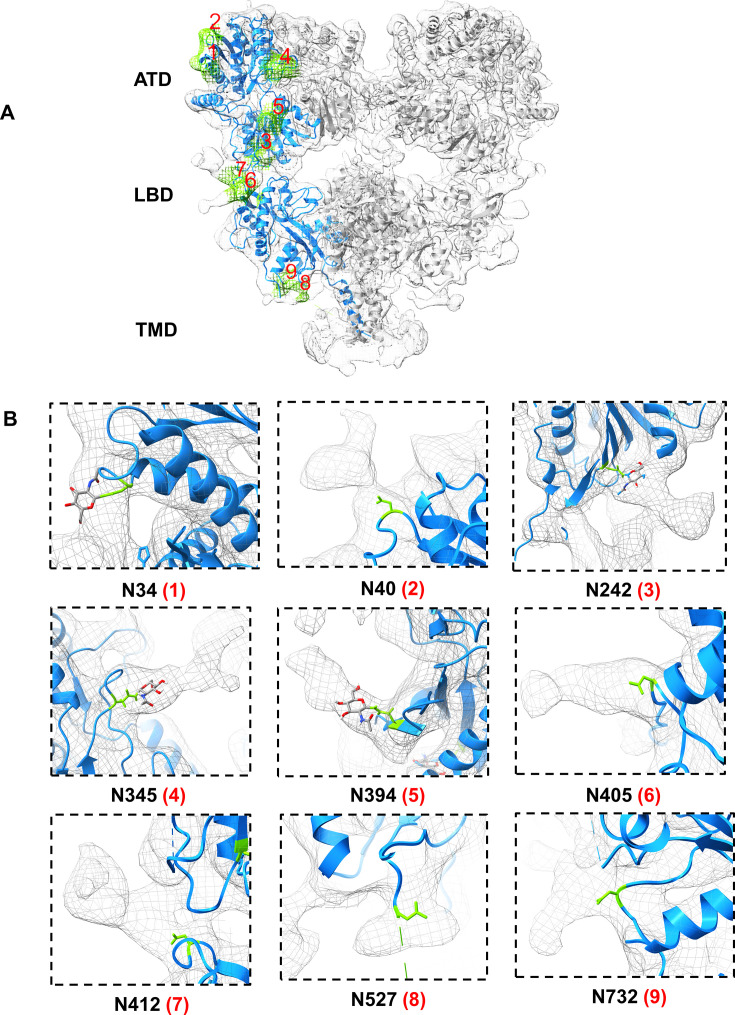
Figure 6—figure supplement 8. EM density map labeled to show predicted N-linked glycosylation sites (NXT) for GluK1-1aEM.

Figure 6—figure supplement 8.

(A) Shows GluK1-1aEM ND with a fitted model in EM density. Chain A is emphasized in blue, and the residual N-linked glycan densities are shown in green color with respective Asn residues labeled from 1 to 9. (B) Shows zoomed view of individual Asn residues with side chain shown as a stick model and the corresponding glycan density in mesh form. For N34, N242, N345, and N394 residues, glycan density (NAG) observed in the GluK1-1a ATD crystal structure has been depicted with a conventional color scheme (C- gray, O- red, N- blue, H- white).
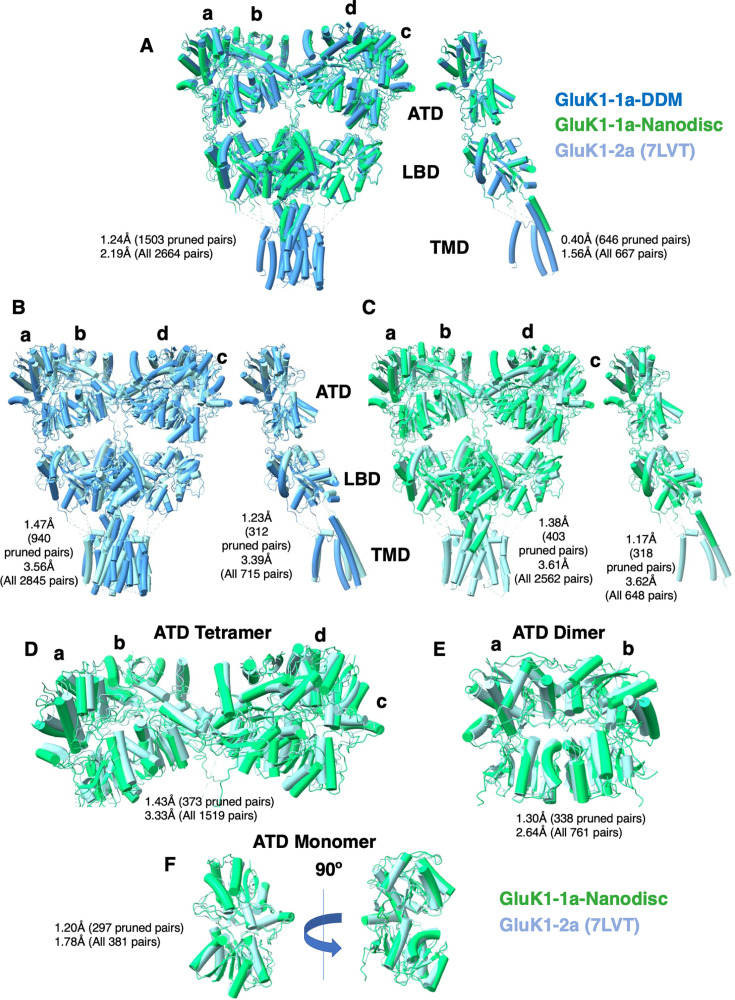
Figure 6—figure supplement 9. Comparison between GluK1-1aEM (detergent-solubilized or reconstituted in nanodiscs) and GluK1-2a (PDB-7LVT) in the desensitized state.

Figure 6—figure supplement 9.

Each panel (A–F) illustrates a pairwise comparison with superimposed structures, where the root-mean-square deviation (RMSD) values, measured in Å, are indicated adjacent to each comparison. The structural comparison was carried out in ChimeraX and indicates significant structural similarities between all the protein models. The superimposition does not show significant differences in the arrangement at both amino-terminal domain (ATD) and ligand binding domain (LBD) layers of GluK1-1a with respect to GluK1-2a.