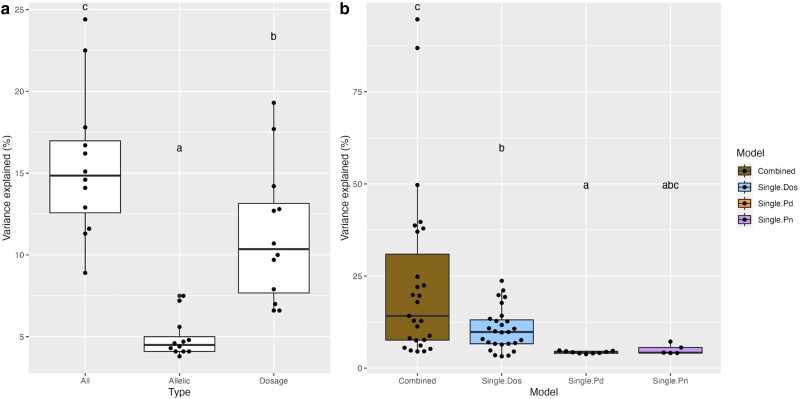
Fig. 5.
Phenotypic variance explained using the single and combined models. a) Phenotypic variance explained by allelic and dosage variation using single models. 12 traits were selected for the observation of both allelic and dosage QTLs. On the x-axis, All represents the variance explained by all QTLs identified using the three single models. Allelic represents the variance explained by the collection of QTLs from P. deltoides and P. nigra haplotypes. Dosage represents the variance explained by dosage variation. b) Comparison of the percentage of phenotypic variance explained by the single and combined models. On the x-axis, Combined represents the variance explained by QTLs observed from the combined model. Single.Dos, Single.Pd and Single.Pn represent QTLs identified from three single models associated with dosage variation, P. deltoides haplotypes, and P. nigra haplotypes, respectively. Statistical significance was calculated through pairwise permutation tests (P-value < 0.05).

