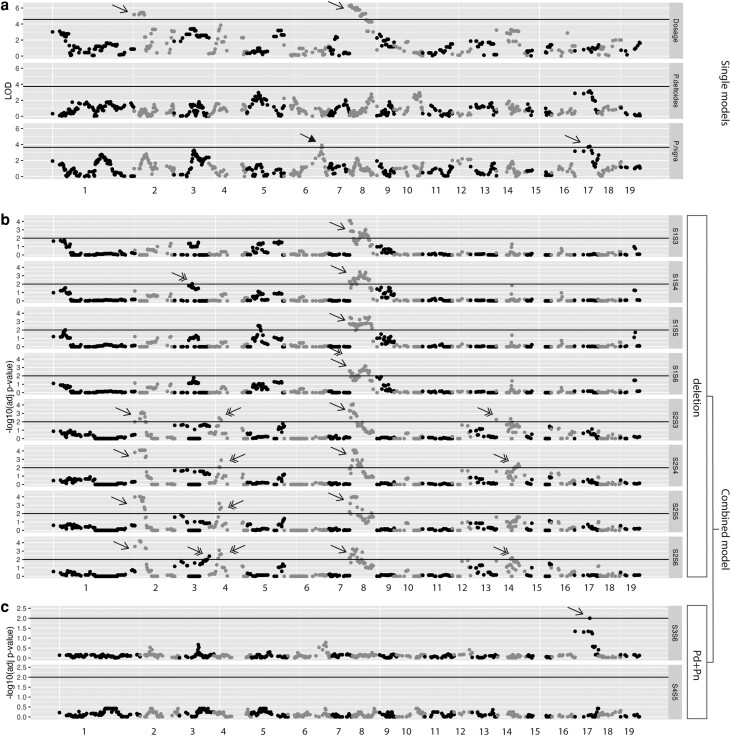
Fig. 8.
Examples of QTLs identified using the single and combined models on the phenology-related trait Time_serie_bud_burst_y1_y2. Each dot represents a genetic marker. The X-axis indicates genomic positions. The y-axis indicates the LOD scores (a) or adjusted P-value with negative log10 fold (b, c). Dots above the horizontal lines were selected as QTLs. These QTLs were categorized as observed only in the single models (triangle arrow), only in the combined model (double arrows) and in both single and combined models (single arrows). a) LOD scores of genetic markers from three single models. Top: Trait ∼ Dosage; Middle: Trait ∼ P. deltoides haplotype; Bottom: Trait ∼ P. nigra haplotype. (b, c) Combined model categorized QTLs into 6 groups based on their origin. Deletion (b) and P. deltoide + P. nigra (Pd + Pn) (c) groups are shown here because QTLs were identified in these comparisons. b) Each plot represents one pairwise comparison between two genotype states for which genotypes are equal but dosage varies. c) Each plot represents one pairwise comparison between two genotype states for which dosage is equal but the P. deltoides and P. nigra haplotypes vary.

