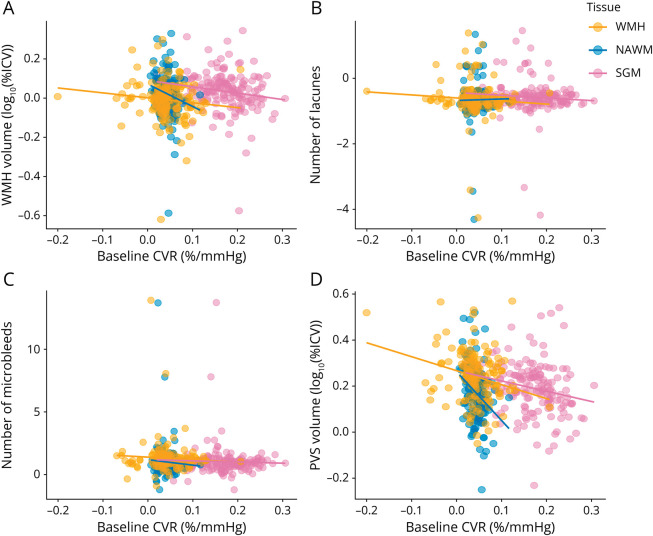
Figure 4. Relationships Between SVD Features After 1 Year and Baseline CVR.
SVD features shown are (A) WMH volume, (B) number of lacunes, (C) number of microbleeds, and (D) BG PVS volumes. SVD features of interest at 1-year follow-up were adjusted for the corresponding SVD features of interest at baseline, age, sex, and vascular risk factors. The results are shown for adjusted CVR in SGM (pink), NAWM (green), and WMH (blue). The regression lines are shown in the plots. BG = basal ganglia; CVR = cerebrovascular reactivity; NAWM = normal-appearing white matter; PVS = perivascular space; SGM = subcortical gray matter; SVD = small vessel disease; WMH = white matter hyperintensity.

