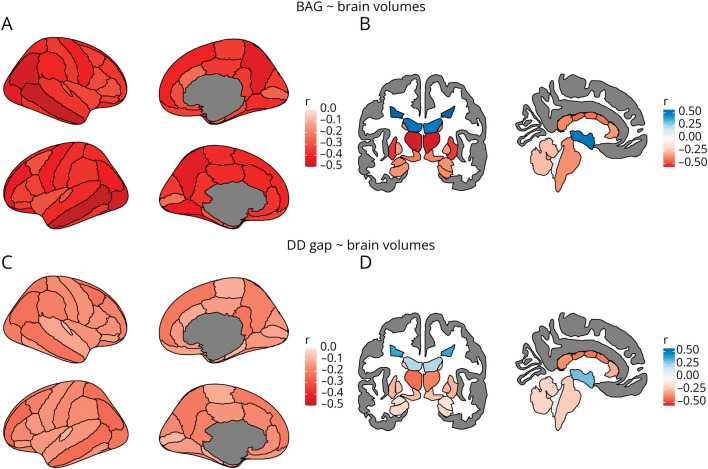
Figure 4. Correlations Between Brain-Age and Disease Duration Gaps and Regional Brain and Lesion Volumes.
In the upper row, plots show the correlations between brain-age gap values and cortical (A) and subcortical/lesion (B) volumes. In the bottom row, plots show the correlations between disease duration gap values and cortical (C) and subcortical/lesion (D) volumes. Shown are the Pearson correlation coefficients resulting from partial correlation analyses correcting for age, age2, disease duration, sex, and estimated total intracranial volume. The cortex is parcellated according to the DKT atlas.21 BAG = brain-age gap; DD = disease duration.

