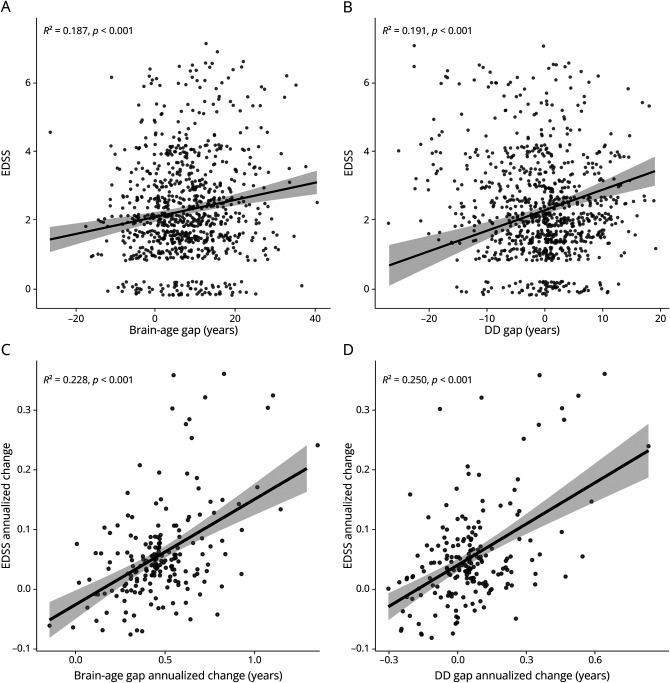
Figure 6. Relationships Between Brain-Age and Disease Duration Gaps and Physical Disability.
In the upper row, scatterplots show the marginal effects on EDSS scores of the brain-age (A) and disease duration (B) gap metrics (regression models were corrected for the effects of age, age2, disease duration, and sex). In the bottom row, scatterplots show the relationship between annualized changes in EDSS and brain-age (C) and disease duration (D) gaps. Linear fit lines are shown as solid lines (with corresponding 95% confidence intervals in gray). DD = disease duration; EDSS = Expanded Disability Status Scale.

