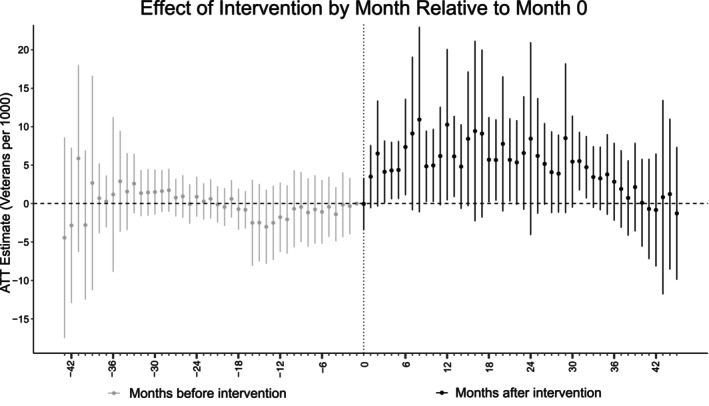
FIGURE 2.

Dynamic event‐study plot of the cumulative effect of the program by month of participation, where month 0 is the month just prior to the start of the first program‐funded social worker at each site. Each point represents the difference‐in‐differences in the proportion of Veterans per 1000 with 1+ social work encounter for that month, relative to changes for sites that had not yet started the program. ATT, average treatment effect on the treated.
