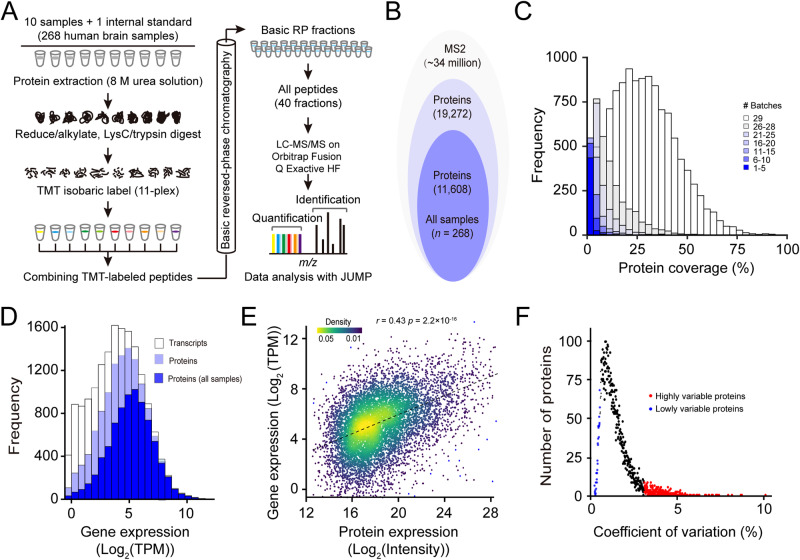
Fig. 2. Deep profiling of human brain proteome.
A Workflow of 11-plex TMT-based proteome analysis. A total of 10 samples and 1 internal standard (i.e., 10 pooled samples) were analyzed by LC/LC-MS/MS. MS raw data were analyzed using JUMP software. B Stacked Venn diagram showing the numbers of proteins identified in all 268 samples. C Histogram showing the coverage of quantified proteins across 29 batches of TMT experiments. D Histogram showing the coverage of proteomic data compared to RNA-seq data. The open bar represents the distribution of protein-coding genes detected by RNA-seq, the light blue bar indicates the distribution of protein-coding genes from proteomic data, and the navy bar indicates the distribution of protein-coding genes from no missing value proteomic data. Protein coverage is defined as the determination of whether a transcript is expressed in one or more samples. E Scatter plot showing a comparison of gene expression levels and protein abundance. Expression levels are averaged across all samples. F Distribution of coefficient of variation (CV) for all proteins across all samples.

