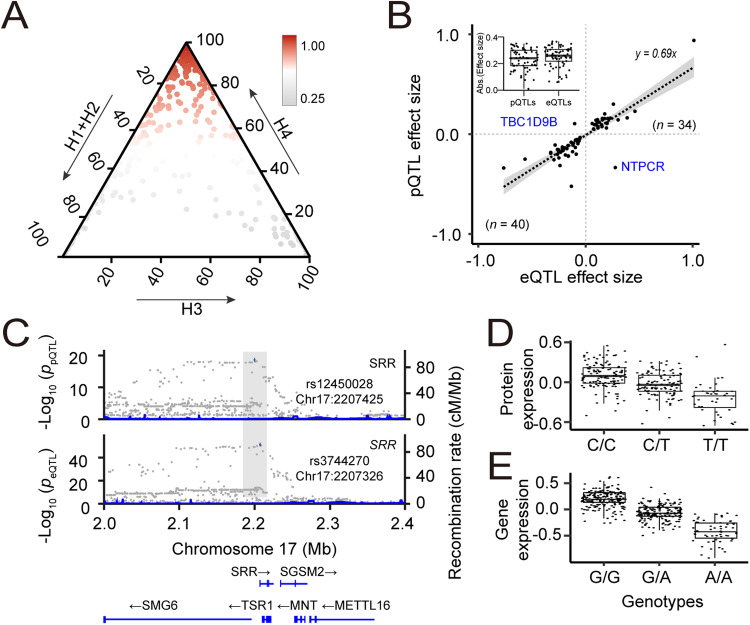
Fig. 4. Co-localized QTLs modulating the expression levels of genes and proteins.
A Ternary plot showing colocalization posterior probabilities of QTLs of gene and protein expression. We considered H0 + H1 + H2 as evidence for the lack of test power. H0: no causal variant, H1: causal variant for PD GWAS only, H2: causal variant for QTL only, H3: two distinct causal variants, H4: one common causal variant. B Scatter plot showing the distribution of effect sizes of 76 matched SNP-eQTLs and SNP-pQTLs colocalized pairs. C LocusZoom plot showing a colocalized QTL regulating SRR gene and protein expression. D Box plot showing normalized SRR protein expression and its cis-pQTL allele dosage. E Box plot showing normalized SRR gene expression and its cis-eQTL allele dosage.

