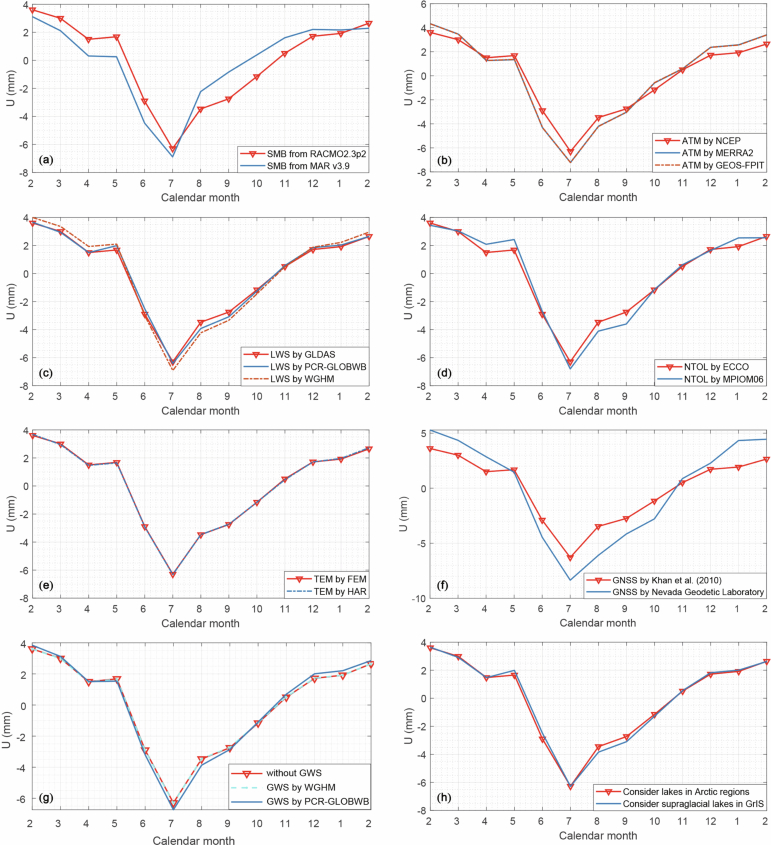
Extended Data Fig. 4. Estimation of individual contributors to the error budget for the residual vertical displacement mean annual cycle at the KAGA station.
For that purpose, either the primary GNSS data themselves or one of the primary background models of nuisance signals (red lines) are replaced with one or two alternatives (green and black lines). The panels present different estimates of SMB loading variations (the estimated uncertainty is 0.71 mm) (a); ATM loading variations (0.35 mm) (b); LWS loading (0.21 mm) (c); NTOL loading variations (0.25 mm) (d); TEM variations (0.02 mm) (e); GNSS solutions (1.04 mm) (f); groundwater loading (0.24 mm) (g); and water mass loading from lakes in Arctic regions (0.008 mm) and supraglacial lakes in GrIS (0.02 mm) (h).

