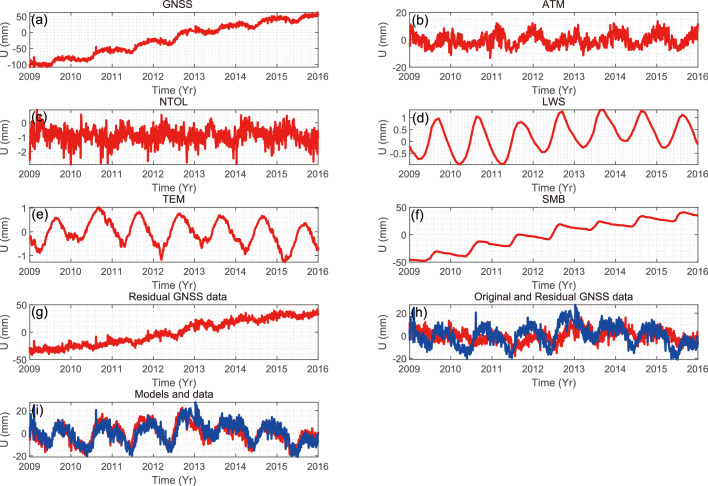
Extended Data Fig. 3. Vertical bedrock displacements and the contribution of nuisance signals.
Time series of observed vertical displacements at the KAGA station (panel a) and time series calculated for different nuisance signals, as listed in Extended Data Table 1: ATM, NTOL, LWS, TEM and SMB (panels b–f), as well as the residual displacements after subtracting the calculated nuisance signals (panel g), the observed (blue) versus the residual displacements (red) after detrending (panel h) and the observed (blue) versus modelled displacements (red) after detrending (panel i). Note the different vertical scales.

