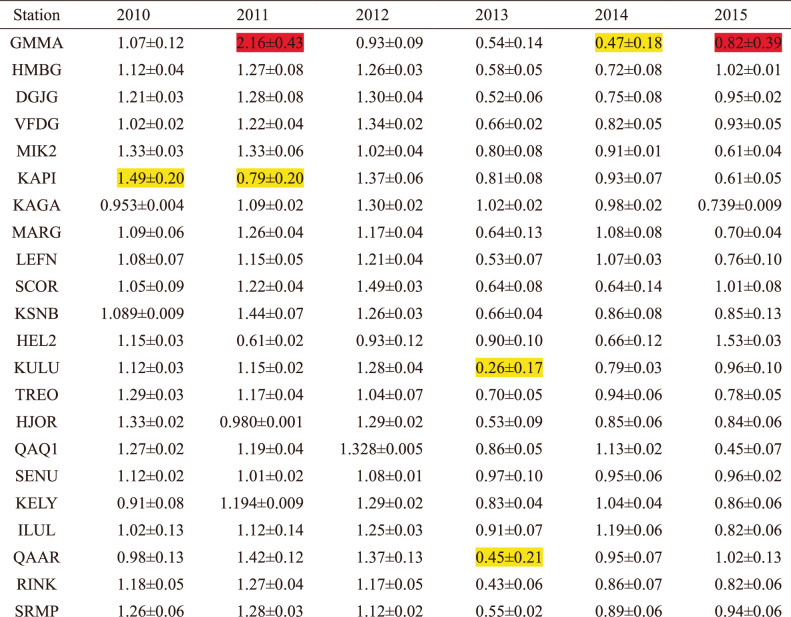
Extended Data Table 4.
Scaling factors (1 + ϵk) based on three estimation strategies per year per GNET station
Each of the scaling factors under consideration is estimated in three different ways: (1) using equation (17); (2) using equation (19), while limiting the input data time series to 6 months per year (November–April); and (3) also using equation (19) but after limiting the input data time series to only 4 months per year (December–March). The mean of the three estimates and the associated standard deviation is reported. The values with standard deviations larger than 0.15 and 0.30 are highlighted in yellow and red, respectively.

