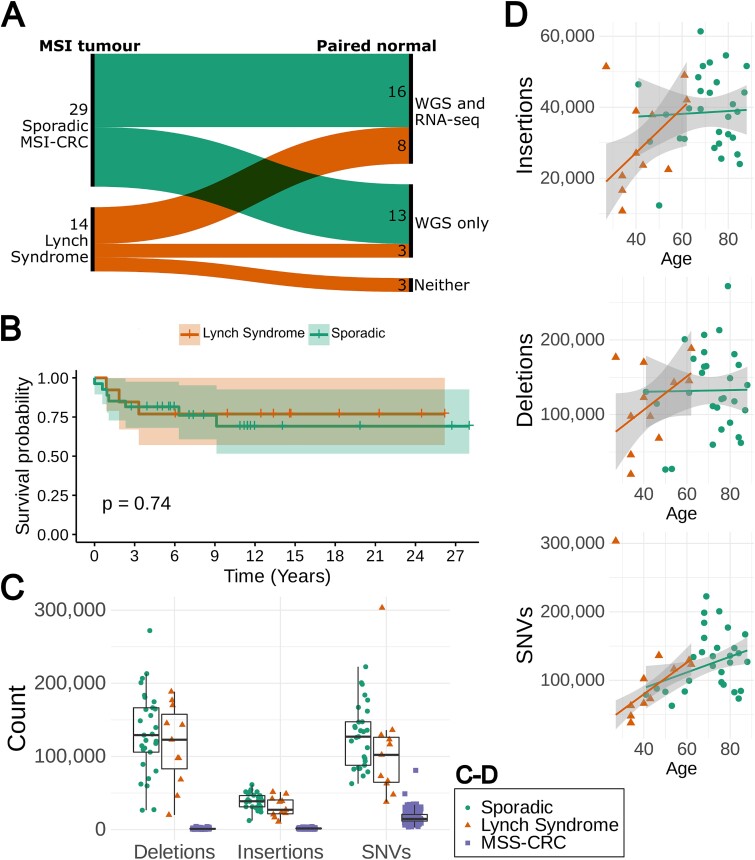
Figure 1.
(A) Sankey diagram showing the 29 sporadic and 14 LS MSI-CRCs and the number of each that had paired normal data available for both WGS and RNA-seq, only for WGS, or for neither analysis. (B) Kaplan–Meier curve of CRC-specific survival in 27 sporadic MSI and 13 LS patients for whom up-to-date cause of death information was available or are still living. Time is shown in years. (C) The total numbers of deletions, insertions and SNVs in 11 LS and 29 sporadic MSI-CRCs compared to 221 MSS-CRCs [12]. (D) The number of variants from WGS data against the age of the patients in 11 LS and 29 sporadic MSI-CRCs with a robust linear regression model fitted.

