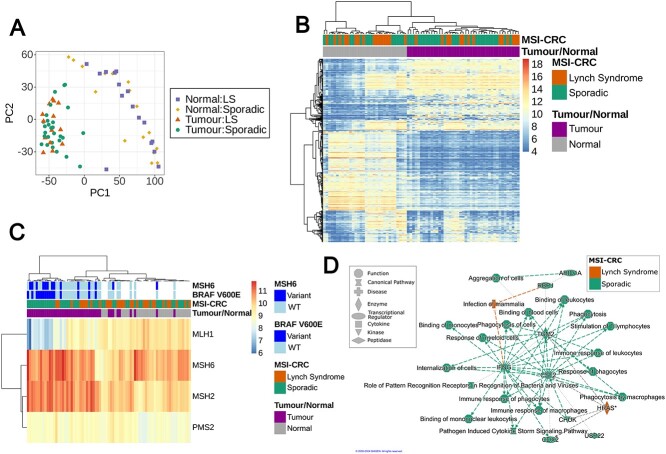
Figure 2.
Global gene expression in 29 sporadic and 14 hereditary MSI-CRCs along with 16 sporadic and 16 hereditary normal tissues from CRC patients. (A) PCA plot of the 2000 genes with the highest variance in RNA-seq expression data normalised by variance stabilising transformation. (B) Hierarchical clustering with the top 500 most variable autosomal genes following normalisation by variance stabilising transformation. (C) Hierarchical clustering of the expression of four key MMR genes following normalisation by variance stabilising transformation. The annotation indicates the tumour/normal and sporadic/hereditary status of each sample, and whether the tumours carry a somatic BRAF V600E or non-synonymous MSH6 mutation. (D) Graphical summary of the main functions and proteins affected by the 200 differentially expressed genes from a gene ontology analysis by QIAGEN ingenuity pathway analysis software [17]. Green and orange represent a predicted increase in activation in sporadic and LS tumours, respectively.

