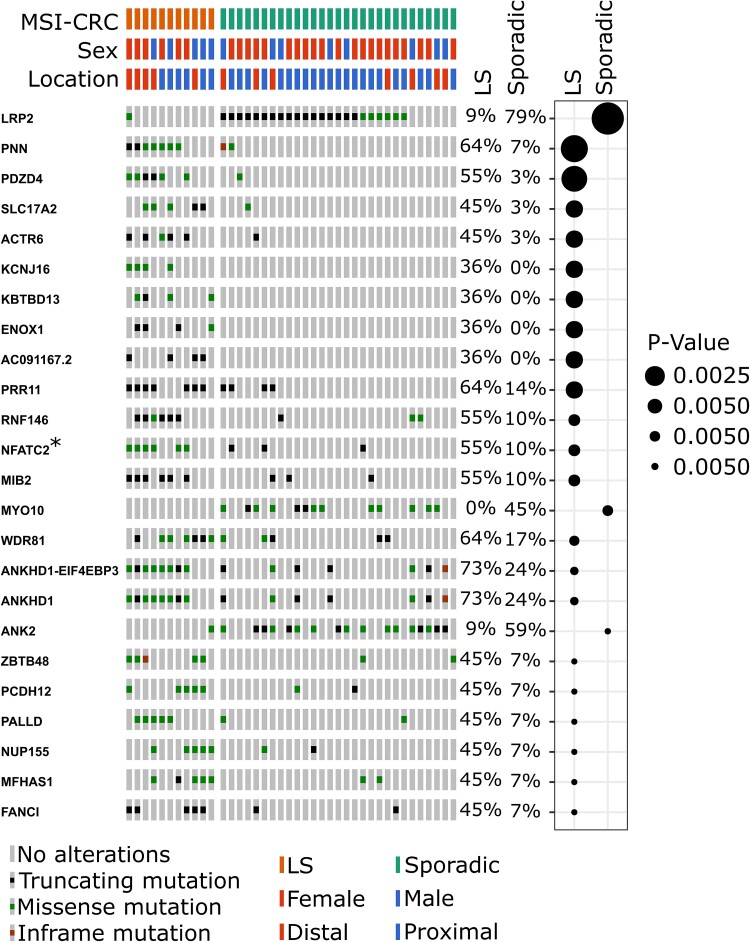
Figure 4.
The top twenty genes with the most differential number of samples carrying non-synonymous mutations between sporadic and hereditary tumours, as ranked by Fisher’s test p-values. The COSMIC cancer gene is indicated by an asterisk. On the right-side, the percentages indicate the proportion of samples carrying mutations, and the plot indicates whether sporadic MSI or LS tumours more frequently carry mutations in each gene and the Fisher’s test p-value. Plots produced by Oncoprinter.

