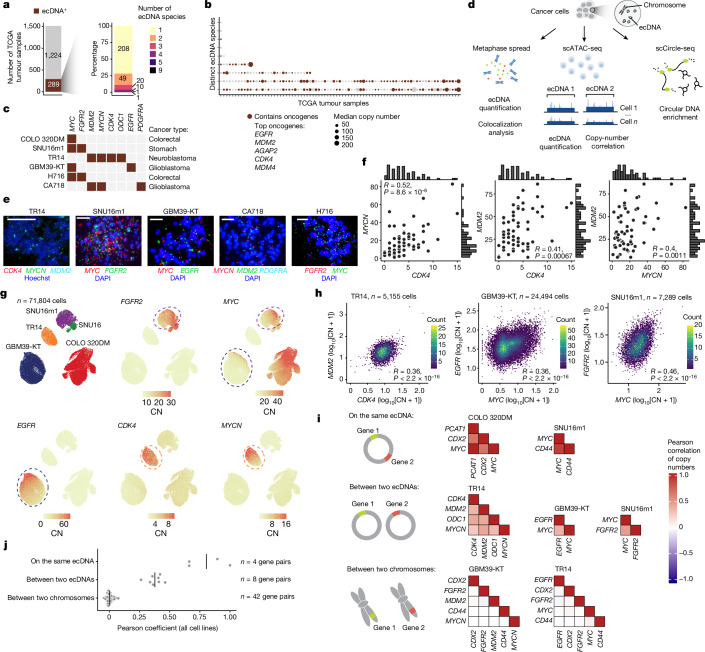
Fig. 1. ecDNA species encoding distinct oncogene sequences are correlated in individual cancer cells.
a, Summary of ecDNA-positive tumours (left) and the number of ecDNA species (right) identified in TCGA tumour samples. b, The median copy numbers and oncogene statuses of distinct ecDNA species in TCGA tumours that were identified to have more than one ecDNA species. c, A panel of cell lines with known oncogene sequences on ecDNA. d, Schematic of the ecDNA analyses using three orthogonal approaches: metaphase spread, scATAC-seq and scCircle-seq. e, Representative DNA-FISH images of metaphase spreads with FISH probes targeting various oncogene sequences as indicated. n = 64 (TR14), n = 76 (SNU16m1), n = 62 (GBM39-KT), n = 70 (CA718) and n = 82 (H716) cells. Scale bars, 10 µm. f, Oncogene copy-number scatter plots and histograms of pairs of oncogenes in TR14 cells. Statistical analysis was performed using two-sided Spearman correlation. g, Uniform manifold approximation and projection (UMAP) analysis of scATAC-seq data showing cell line annotations and copy-number (CN) calculations of indicated oncogenes. h, The log-transformed oncogene copy numbers between pairs of oncogenes in the indicated cell lines (Pearson’s R, two-sided test; P < 2.2 × 10⁻¹⁶ for all correlations). i, Pearson correlation heat maps of gene pairs on the same ecDNA (top), between two ecDNAs (middle) and between two chromosomes (bottom). j, Pearson correlation coefficients of gene pairs on the same ecDNA (n = 4 gene pairs), between two ecDNAs (n = 8 gene pairs) and between two chromosomes (n = 42 gene pairs) in COLO 320DM, SNU16, SNU16m1, TR14 and GBM39-KT cells.

