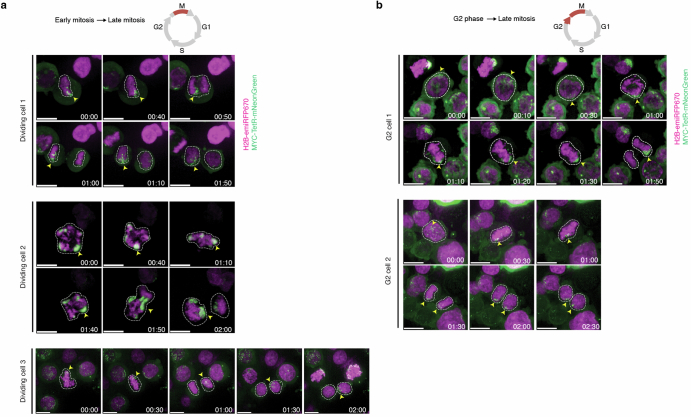
Extended Data Fig. 6. Live cell imaging of ecDNA localization during cell division.
(a-b) Representative time-lapsed images of TetR-mNeonGreen labelled TetO-MYC ecDNAs in COLO 320DM cells undergoing early to late mitosis (3 dividing cell pairs) (a) and G2 to late mitosis (2 dividing cell pairs) (b) (n = 30 cell divisions over 5 independent time-lapse experiments). H2B-emiRFP670 labels histone H2B to aid identification of mitotic chromosomes and/or nuclear boundaries. White dash lines denote the mitotic cell across time frames; clumps of ecDNA molecules observed throughout mitosis are indicated with yellow arrowheads. Time stamp is denoted in hh:mm format. Scale bar = 10 μm.

